
cancel
Showing results for 
Search instead for 
Did you mean: 

July 7 - July 17 | Round 2 of the Power BI Dataviz World Championships. Don't miss your chance! Learn more

Reply
bnevers
Regular Visitor

Aggregating Across Common Values

I have timecard data in a PowerBI table that looks like this:


Staff     Project     Hours

A          1000          2

A          2000          4

A          3000          2

B          1000          3

B          2000          1

B          4000          3


I would like to create a table that sums the hours each individual spent working on common projects with each other individual. In this case, A worked on projects 1000 and 2000 with B and vice versa. So the summary table would look like this:


Staff       A                 B

A            -               2+4 = 6

B            3+1=4        


Is there a way to do this with DAX? Any help is appreciated. 

2 ACCEPTED SOLUTIONS
AlB
Community Champion
Community Champion

Hi @bnevers 

Try this

1. Place Table1[Staff] in a table visual 

2. Place this measure in the visual

Measure =
SUMX (
    Table1;
    IF (
        CALCULATE (
            COUNT ( Table1[Project] );
            ALL ( Table1[Hours] );
            FILTER (
                ALL ( Table1[Staff] );
                Table1[Staff] <> SELECTEDVALUE ( Table1[Staff] )
            )
        ) <> 0;
        Table1[Hours]
    )
)


Please mark the question solved when done and consider giving kudos if posts are helpful.

Cheers  Datanaut

View solution in original post

Ashish_Mathur
Super User
Super User

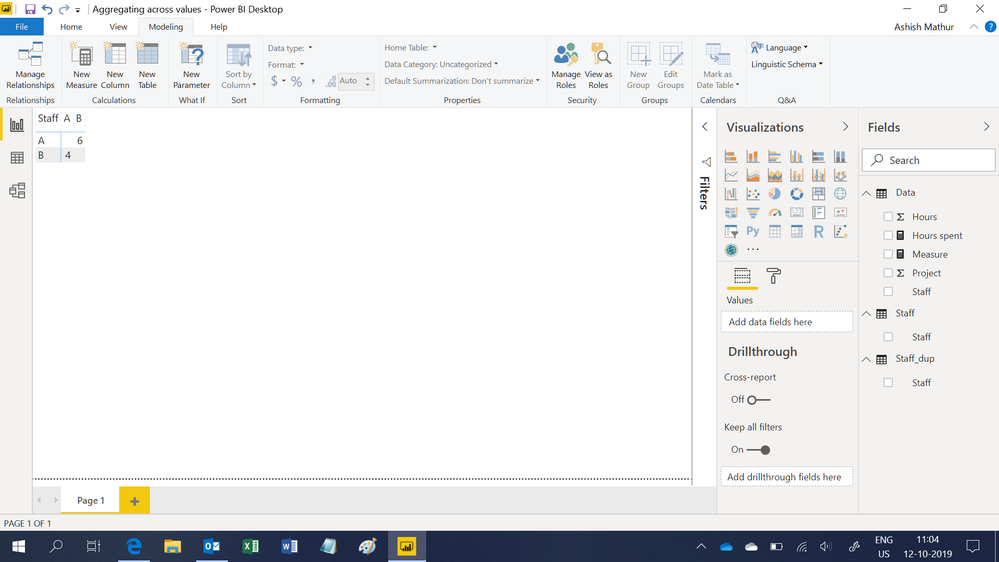
Hi,

You may download my PBI file from here.

Hope this helps.

Untitled.png


Regards,
Ashish Mathur
http://www.ashishmathur.com
https://www.linkedin.com/in/excelenthusiasts/

View solution in original post

3 REPLIES 3
Ashish_Mathur
Super User
Super User

Hi,

You may download my PBI file from here.

Hope this helps.

Untitled.png


Regards,
Ashish Mathur
http://www.ashishmathur.com
https://www.linkedin.com/in/excelenthusiasts/

Perfect - thank you!!
AlB
Community Champion
Community Champion

Hi @bnevers 

Try this

1. Place Table1[Staff] in a table visual 

2. Place this measure in the visual

Measure =
SUMX (
    Table1;
    IF (
        CALCULATE (
            COUNT ( Table1[Project] );
            ALL ( Table1[Hours] );
            FILTER (
                ALL ( Table1[Staff] );
                Table1[Staff] <> SELECTEDVALUE ( Table1[Staff] )
            )
        ) <> 0;
        Table1[Hours]
    )
)


Please mark the question solved when done and consider giving kudos if posts are helpful.

Cheers  Datanaut

Helpful resources

Announcements
FabCon and SQLCon Barcelona 2026

FabCon & SQLCon – Barcelona 2026

Join us in Barcelona for FabCon and SQLCon, the Fabric, Power BI, SQL, and AI community event. Save €200 with code FABCMTY200.

60 days of Data Days Carousel

Data Days 2026

Join Data Days 2026: 60 days of free live/on-demand sessions, challenges, study groups, and certification opportunities.

Power BI DataViz World Championships carousel

Power BI DataViz World Championships - June 2026

A new Power BI DataViz World Championship is coming this June! Don't miss out on submitting your entry.

Top Solution Authors