FabCon is coming to Atlanta
Join us at FabCon Atlanta from March 16 - 20, 2026, for the ultimate Fabric, Power BI, AI and SQL community-led event. Save $200 with code FABCOMM.
Register now!- Power BI forums
- Get Help with Power BI
- Desktop
- Service
- Report Server
- Power Query
- Mobile Apps
- Developer
- DAX Commands and Tips
- Custom Visuals Development Discussion
- Health and Life Sciences
- Power BI Spanish forums
- Translated Spanish Desktop
- Training and Consulting
- Instructor Led Training
- Dashboard in a Day for Women, by Women
- Galleries
- Data Stories Gallery
- Themes Gallery
- Contests Gallery
- QuickViz Gallery
- Quick Measures Gallery
- Visual Calculations Gallery
- Notebook Gallery
- Translytical Task Flow Gallery
- TMDL Gallery
- R Script Showcase
- Webinars and Video Gallery
- Ideas
- Custom Visuals Ideas (read-only)
- Issues
- Issues
- Events
- Upcoming Events
The Power BI Data Visualization World Championships is back! Get ahead of the game and start preparing now! Learn more
- Power BI forums
- Forums
- Get Help with Power BI
- Desktop
- Aggregate sum not available for numeric slicer/sli...
- Subscribe to RSS Feed
- Mark Topic as New
- Mark Topic as Read
- Float this Topic for Current User
- Bookmark
- Subscribe
- Printer Friendly Page
- Mark as New
- Bookmark
- Subscribe
- Mute
- Subscribe to RSS Feed
- Permalink
- Report Inappropriate Content
Aggregate sum not available for numeric slicer/slider
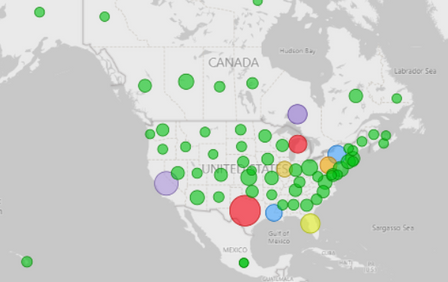
I have created a map that sums membership counts by state.
Fine. Nice bubbles sized by aggregate summary count.
Task: I have created a numeric 'between' slicer/slider to filter results down to only those states with a membership count between x and y.
Problem: The slicer/slider is being created at the detail row level (0 or 1 count for each row) rather than the aggregate summary count per state level as shown in its related bubble map visual.
Question: Can I create a slider control based upon the aggregate summary state count (ex. 1,234 for Texas) rather than the detail row count (1)?
- Mark as New
- Bookmark
- Subscribe
- Mute
- Subscribe to RSS Feed
- Permalink
- Report Inappropriate Content
Thanks for the interest.
Simply put, the below table shows some example source data. Each row has a 0 or 1 for Membership_Count.
The visual above's bubble amounts show the summation of Membership_Count (e.g. 2 for CT, 5 for CA, 7 for TX, 4 for FL, 5 for MI, 0 for LA and NC). This is correct.
The slider shows only 0 to 1, representing Membership_Count on each detail record. This is incorrect.
I'd like the slider to represent State_Province totals from the smallest (e.g. 0 for LA and NC) to largest (e.g. 7 for TX).
Outside of pre-populating the source data with the totals on each row is there a way for PowerBI to do with the slider what it did for the bubbles - sum the total by State_Province.
| Member_Number | Membership_Count | State_Province |
| 123456 | 1 | CT |
| 123457 | 1 | CT |
| 123458 | 1 | CA |
| 123459 | 1 | CA |
| 123460 | 1 | CA |
| 123461 | 1 | CA |
| 123462 | 1 | CA |
| 123463 | 0 | NC |
| 123464 | 1 | TX |
| 123465 | 1 | TX |
| 123466 | 1 | TX |
| 123467 | 1 | TX |
| 123468 | 1 | TX |
| 123469 | 1 | TX |
| 123470 | 1 | TX |
| 123471 | 1 | FL |
| 123472 | 1 | FL |
| 123473 | 1 | FL |
| 123474 | 1 | FL |
| 123475 | 0 | LA |
| 123476 | 1 | MI |
| 123477 | 1 | MI |
| 123478 | 1 | MI |
| 123479 | 1 | MI |
| 123480 | 1 | MI |
- Mark as New
- Bookmark
- Subscribe
- Mute
- Subscribe to RSS Feed
- Permalink
- Report Inappropriate Content
Hi @Anonymous ,
Could you please provide some sample data and your desired output? I cannot understand your meaning correctly. you can create simple data with excel, then show me the screenshots about the data and the desired output your want.
Best regards.
Helpful resources

Power BI Monthly Update - November 2025
Check out the November 2025 Power BI update to learn about new features.

Fabric Data Days
Advance your Data & AI career with 50 days of live learning, contests, hands-on challenges, study groups & certifications and more!

| User | Count |
|---|---|
| 58 | |
| 45 | |
| 40 | |
| 21 | |
| 18 |

