cancel
Showing results for 
Search instead for 
Did you mean: 

July 7 - July 17 | Round 2 of the Power BI Dataviz World Championships. Don't miss your chance! Learn more

Reply
Anonymous
Not applicable

Affect value based on date range

Hi,

I am quite new to PowerBI, and I want to do something that I am able to do with Excel and Macros

I have one table called SALES

Order,Order_Date,Product,EAN,Categorie,Volume,Price


On the column Order, I have the Order number

On the column Order_Date, I have the date when the order was placed (this is important)

Product is the production description

EAN is the EAN of the product

Volume is the number of piece ordered

Price is the total price for this EAN and this product


I have an other table CATEGORIE : 

EAN,Supplier, Categorie, Start_Date, End_Date


On the table, one EAN may appears many time, as its categorie will change from time to time.

For exemple : 

EAN1234547899,Nike,Category1, 2018-01-01, 2018-31-01

EAN1234547899,Nike,Category2, 2018-01-02, 2018-28-02


This means that from January 1st to the end of the month, the product will be part of the category 1

And, from february 1st to the end of the month, it will be part of Category2.


To know to which category I have to affect an order, it will depends on the order date.


If 5 orders are placed on january 15th, they will be affected to Categorie 1, and 18 orders placed on february 23, they will be category 2


Now, on my reports, I want to have a vision by Suppliers then by Category.


So it should be : 

Nike

    Category1 : 5

    Category2 : 18


Is there any way to manage that ?


I hope I was clear.


Thanks for your help


1 ACCEPTED SOLUTION
v-yulgu-msft
Microsoft Employee
Microsoft Employee

Hi @Anonymous,


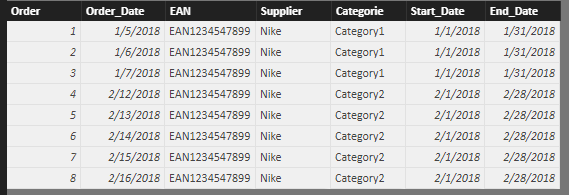
First cross join SALES table and CATEGORIE table.

Table_1 =
FILTER (
    CROSSJOIN (
        SELECTCOLUMNS ( SALES, "Order", SALES[Order], "Order_Date", SALES[Order_Date] ),
        CATEGORIE
    ),
    [Order_Date] >= [Start_Date]
        && [Order_Date] <= [End_Date]
)

1.PNG


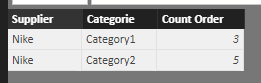
Then, calculate the order number grouped on Suppliers and Category.

Table_2 =
SUMMARIZE (
    Table_1,
    Table_1[Supplier],
    Table_1[Categorie],
    "Count Order", COUNT ( Table_1[Order] )
)

2.PNG


Best regards,

Yuliana Gu

Community Support Team _ Yuliana Gu
If this post helps, then please consider Accept it as the solution to help the other members find it more quickly.

View solution in original post

2 REPLIES 2
v-yulgu-msft
Microsoft Employee
Microsoft Employee

Hi @Anonymous,


First cross join SALES table and CATEGORIE table.

Table_1 =
FILTER (
    CROSSJOIN (
        SELECTCOLUMNS ( SALES, "Order", SALES[Order], "Order_Date", SALES[Order_Date] ),
        CATEGORIE
    ),
    [Order_Date] >= [Start_Date]
        && [Order_Date] <= [End_Date]
)

1.PNG


Then, calculate the order number grouped on Suppliers and Category.

Table_2 =
SUMMARIZE (
    Table_1,
    Table_1[Supplier],
    Table_1[Categorie],
    "Count Order", COUNT ( Table_1[Order] )
)

2.PNG


Best regards,

Yuliana Gu

Community Support Team _ Yuliana Gu
If this post helps, then please consider Accept it as the solution to help the other members find it more quickly.
Anonymous
Not applicable

Hi,

Sorry for my late reply. Thanks for your solution.

Regards,

Helpful resources

Announcements
FabCon and SQLCon Barcelona 2026

FabCon & SQLCon – Barcelona 2026

Join us in Barcelona for FabCon and SQLCon, the Fabric, Power BI, SQL, and AI community event. Save €200 with code FABCMTY200.

60 days of Data Days Carousel

Data Days 2026

Join Data Days 2026: 60 days of free live/on-demand sessions, challenges, study groups, and certification opportunities.

Power BI DataViz World Championships carousel

Power BI DataViz World Championships - June 2026

A new Power BI DataViz World Championship is coming this June! Don't miss out on submitting your entry.

Top Solution Authors