This is best Fabric, Power BI, SQL and AI community event. How do we know? The last event sold out! Save €200 with code FABCMTY200.
Register nowThe Fabric community is upgrading! Read all of the details including the timeline and what you can expect. Learn more
Hi,
I want to add explanations for the various columns, measures, and visuals. I would like this to be pop out or hover over rather than written diectly to the report page. Is there a way to use the 'description' feature for this? I had assumed that the whole point of the description was that if I hover over a variable I would see the description, and was disappointed to find this isn't the case.
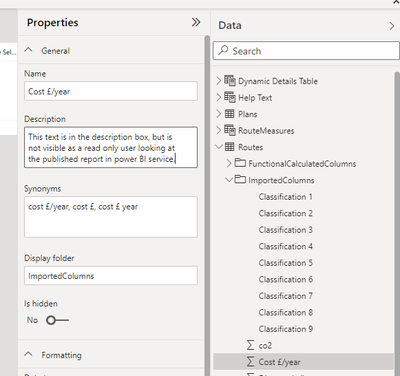
I want this blurb to appear when I hover over something as below.
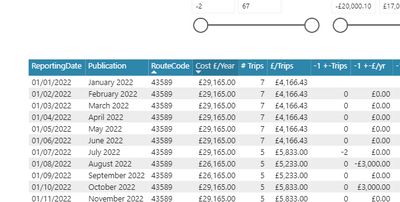
NOTE:
I am aware I can laboriously write a load of transparent buttons, each with it's own explainer, and hover those buttons over the fields throughout my report, but that seems laborious. I could also make a single help button with all the explainers, but that seems clunky for the large number of variables I have.
Thx in advance!
Solved! Go to Solution.
@CHaines , Log an idea for the missing feature https://ideas.powerbi.com/ideas/
Refer if this approach from Guyinacube can help
https://www.youtube.com/watch?v=yYr_SlG8bpw
I'll accept the guy-in-a-cube idea of making a single image helper as a solution, though since it isn't dynamic, it's much less helpful than I was hoping for.
I have upvoted someone elses feature suggestion for this. Future readers, please upvote this idea here.
@CHaines , Log an idea for the missing feature https://ideas.powerbi.com/ideas/
Refer if this approach from Guyinacube can help
Join us in Barcelona for FabCon and SQLCon, the Fabric, Power BI, SQL, and AI community event. Save €200 with code FABCMTY200.
| User | Count |
|---|---|
| 27 | |
| 22 | |
| 20 | |
| 18 | |
| 14 |
| User | Count |
|---|---|
| 25 | |
| 20 | |
| 20 | |
| 20 | |
| 20 |