Get Fabric or SQL Certified for Free.
Get certified for free when you join Fabric Data Days 2026 and dive into Fabric, Power BI, SQL, AI, and other essential data skills.
Join now- Power BI forums
- Get Help with Power BI
- Desktop
- Service
- Report Server
- Power Query
- Mobile Apps
- Developer
- DAX Commands and Tips
- Custom Visuals Development Discussion
- Health and Life Sciences
- Power BI Spanish forums
- Translated Spanish Desktop
- Training and Consulting
- Instructor Led Training
- Dashboard in a Day for Women, by Women
- Galleries
- Data Stories Gallery
- Themes Gallery
- Contests Gallery
- QuickViz Gallery
- Quick Measures Gallery
- Visual Calculations Gallery
- Fabric Apps Gallery
- Notebook Gallery
- Translytical Task Flow Gallery
- TMDL Gallery
- R Script Showcase
- Webinars and Video Gallery
- Ideas
- Custom Visuals Ideas (read-only)
- Issues
- Issues
- Events
- Upcoming Events
July 7 - July 17 | Round 2 of the Power BI Dataviz World Championships. Don't miss your chance! Learn more
- Power BI forums
- Forums
- Get Help with Power BI
- Desktop
- Add Up Column In A Table
- Subscribe to RSS Feed
- Mark Topic as New
- Mark Topic as Read
- Float this Topic for Current User
- Bookmark
- Subscribe
- Printer Friendly Page

- Mark as New
- Bookmark
- Subscribe
- Mute
- Subscribe to RSS Feed
- Permalink
- Report Inappropriate Content
Add Up Column In A Table
Hi All,
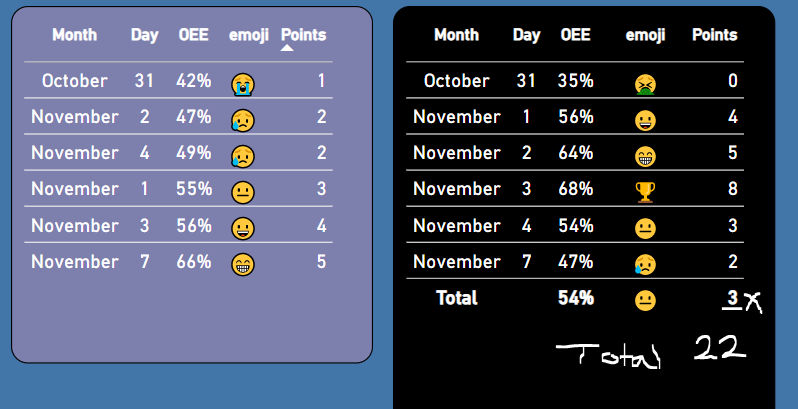
Pretty new to Power Bi. I can’t get this column in this table to add up.
They are two measures.
“OEE = %”
“Points = whole number”
When it totals at the bottom, it picks up the average of the OEE total and scores the total as 3, but the total of the column = 22
How do I get this to show 22?
If it can't be done in the table, is there a measure I can use in card visual to show 22 instead?
Solved! Go to Solution.
- Mark as New
- Bookmark
- Subscribe
- Mute
- Subscribe to RSS Feed
- Permalink
- Report Inappropriate Content
Hi @tomsmith213 ,
You can create another new measure as below and put this new measure to replace the original measure [Points] onto the table visual...
New Measure = SUMX ( GROUPBY ( 'Table', 'Table'[Month], 'Table'[Day] ), [Points] )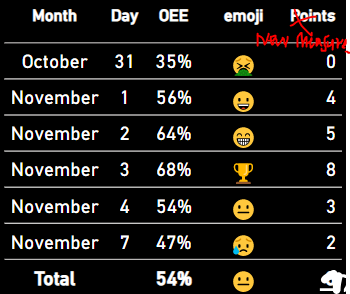
In addition, you can refer the following links to try to solve your problem...
Why Your Total Is Incorrect In Power BI - The Key DAX Concept To Understand
Dax for Power BI: Fixing Incorrect Measure Totals
If the above one can't help you get the desired result, please provide some sample data in your table(exclude sensitive data) with Text format and your expected result with backend logic and special examples. It is better if you can share a simplified pbix file. You can refer the following link to upload the file to the community. Thank you.
How to upload PBI in Community
Best Regards
- Mark as New
- Bookmark
- Subscribe
- Mute
- Subscribe to RSS Feed
- Permalink
- Report Inappropriate Content


- Mark as New
- Bookmark
- Subscribe
- Mute
- Subscribe to RSS Feed
- Permalink
- Report Inappropriate Content
Hi @tomsmith213 ,
try to use this measure in a card
Measure =
SUMX(
 ADDCOLUMNS(
            ADDCOLUMNS(
                    SUMMARIZE(Table,
                              Table[Day],
                              Table[Month ]
                              ),
                   "@Pct",[OEE]
                   ),

         "@Points",SWITCH(TRUE(),
                           [@Pct] <= 0.35, 3,
                           [@Pct] <= 0.45, 6,
                           10
                          )
                   ),
        [@Points]
)
If this post helps, then please consider Accept it as the solution to help the other members find it more quickly.
- Mark as New
- Bookmark
- Subscribe
- Mute
- Subscribe to RSS Feed
- Permalink
- Report Inappropriate Content
Hi @tomsmith213 ,
try to use this measure
SUMX(
SUMMARIZE('Table',
'Table'[Month],
'Table'[Day]
),
[Points]
)
If this post helps, then please consider Accept it as the solution to help the other members find it more quickly.
- Mark as New
- Bookmark
- Subscribe
- Mute
- Subscribe to RSS Feed
- Permalink
- Report Inappropriate Content
Hi, thanks for the reply, however im not using a ‘table’
It’s a table visual just with a few measures inside of it.
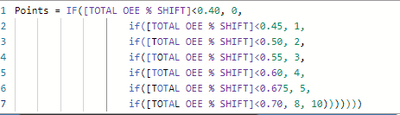
Below is the measure for points, which I dragged into the table.
All I need to do, is add up the points as a total.
I would prefer the total of this table shown as a new measure (somehow) so i can place the result in a card visual

- Mark as New
- Bookmark
- Subscribe
- Mute
- Subscribe to RSS Feed
- Permalink
- Report Inappropriate Content
Hi @tomsmith213 ,
You can create another new measure as below and put this new measure to replace the original measure [Points] onto the table visual...
New Measure = SUMX ( GROUPBY ( 'Table', 'Table'[Month], 'Table'[Day] ), [Points] )In addition, you can refer the following links to try to solve your problem...
Why Your Total Is Incorrect In Power BI - The Key DAX Concept To Understand
Dax for Power BI: Fixing Incorrect Measure Totals
If the above one can't help you get the desired result, please provide some sample data in your table(exclude sensitive data) with Text format and your expected result with backend logic and special examples. It is better if you can share a simplified pbix file. You can refer the following link to upload the file to the community. Thank you.
How to upload PBI in Community
Best Regards
- Mark as New
- Bookmark
- Subscribe
- Mute
- Subscribe to RSS Feed
- Permalink
- Report Inappropriate Content
You legend, thanks so much!!

Helpful resources

FabCon & SQLCon – Barcelona 2026
Join us in Barcelona for FabCon and SQLCon, the Fabric, Power BI, SQL, and AI community event. Save €200 with code FABCMTY200.

Power BI Monthly Update - July 2026
Check out the July 2026 Power BI update to learn about new features.

Data Days 2026
Join Data Days 2026: 60 days of free live/on-demand sessions, challenges, study groups, and certification opportunities.

Power BI DataViz World Championships - June 2026
A new Power BI DataViz World Championship is coming this June! Don't miss out on submitting your entry.

| User | Count |
|---|---|
| 30 | |
| 25 | |
| 25 | |
| 23 | |
| 16 |


| User | Count |
|---|---|
| 54 | |
| 35 | |
| 27 | |
| 24 | |
| 20 |


