Hi @JKG,
I created a similar demo. Please download it from the attachment.
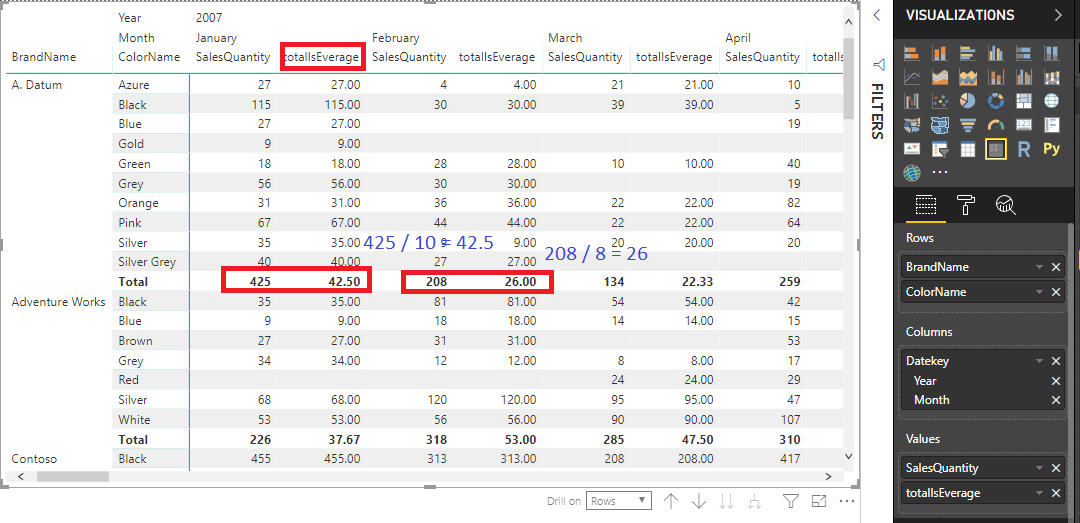
The problem here is we can't add a row. But we can get the result in the Total row. Please refer to the snapshot below.
totalIsEverage =
IF (
    HASONEVALUE ( DimProduct[ColorName] ),
    SUM ( Sales[SalesQuantity] ),
    AVERAGEX (
        SUMMARIZE (
            Sales,
            'Calendar'[Datekey].[Year],
            'Calendar'[Datekey].[Month],
            DimProduct[BrandName],
            DimProduct[ColorName],
            "totalSales", SUM ( Sales[SalesQuantity] )
        ),
        [totalSales]
    )
)
Best Regards,
Community Support Team _ Dale
If this post helps, then please consider Accept it as the solution to help the other members find it more quickly.


