Get certified for free when you join Fabric Data Days 2026 and dive into Fabric, Power BI, SQL, AI, and other essential data skills.
Join nowJuly 7 - July 17 | Round 2 of the Power BI Dataviz World Championships. Don't miss your chance! Learn more
Hi all,
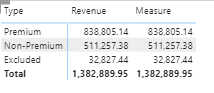
I am trying to get the grand total (1382889.95) showing for each row in "Measure" by using ALL function, but it doesn't seem like it's working. Anyone know what's wrong with my dax?
Both columns are from the same Fact table
Regards,
BK
Solved! Go to Solution.
Hey @Anonymous ,
can you check if the column Fact_Sales[Type] has a sort by column?
If yes, then you also have to remove that filter:
MyMeasure =
CALCULATE(
SUM( Fact_Actual[Revenue] ),
ALL( Fact_Sales[Type] ),
ALL( Fact_Sales[SortByColumn] )
)
Hi, @Anonymous
Please try the below.
Measure = CALCULATE(SUM(Fact_Actual[Revenue]), ALL(Fact_Actual))
Hi, My name is Jihwan Kim.
If this post helps, then please consider accept it as the solution to help other members find it faster, and give a big thumbs up.
Linkedin: linkedin.com/in/jihwankim1975/
Twitter: twitter.com/Jihwan_JHKIM
Hey @Anonymous ,
can you check if the column Fact_Sales[Type] has a sort by column?
If yes, then you also have to remove that filter:
MyMeasure =
CALCULATE(
SUM( Fact_Actual[Revenue] ),
ALL( Fact_Sales[Type] ),
ALL( Fact_Sales[SortByColumn] )
)
Just wanted to thank you for this, I was having the same exact issue and this solved it perfectly!! Now I know I have to remove a sort by feature on a column as well
maybe do the all on the table instead of the column?
Measure = CALCULATE(SUM(Fact_Actual[Revenue]), ALL(Fact_Sales))
Proud to be a Super User!
Join us in Barcelona for FabCon and SQLCon, the Fabric, Power BI, SQL, and AI community event. Save €200 with code FABCMTY200.
Join Data Days 2026: 60 days of free live/on-demand sessions, challenges, study groups, and certification opportunities.
| User | Count |
|---|---|
| 30 | |
| 30 | |
| 25 | |
| 24 | |
| 16 |
| User | Count |
|---|---|
| 57 | |
| 40 | |
| 28 | |
| 24 | |
| 20 |