Join us at FabCon Vienna from September 15-18, 2025
The ultimate Fabric, Power BI, SQL, and AI community-led learning event. Save €200 with code FABCOMM.
Get registered- Power BI forums
- Get Help with Power BI
- Desktop
- Service
- Report Server
- Power Query
- Mobile Apps
- Developer
- DAX Commands and Tips
- Custom Visuals Development Discussion
- Health and Life Sciences
- Power BI Spanish forums
- Translated Spanish Desktop
- Training and Consulting
- Instructor Led Training
- Dashboard in a Day for Women, by Women
- Galleries
- Data Stories Gallery
- Themes Gallery
- Contests Gallery
- Quick Measures Gallery
- Notebook Gallery
- Translytical Task Flow Gallery
- TMDL Gallery
- R Script Showcase
- Webinars and Video Gallery
- Ideas
- Custom Visuals Ideas (read-only)
- Issues
- Issues
- Events
- Upcoming Events
Enhance your career with this limited time 50% discount on Fabric and Power BI exams. Ends August 31st. Request your voucher.
- Power BI forums
- Galleries
- Data Stories Gallery
- EURO 2020 Data Visualization Challenge


- Mark as New
- Bookmark
- Subscribe
- Mute
- Subscribe to RSS Feed
- Permalink
- Report Inappropriate Content
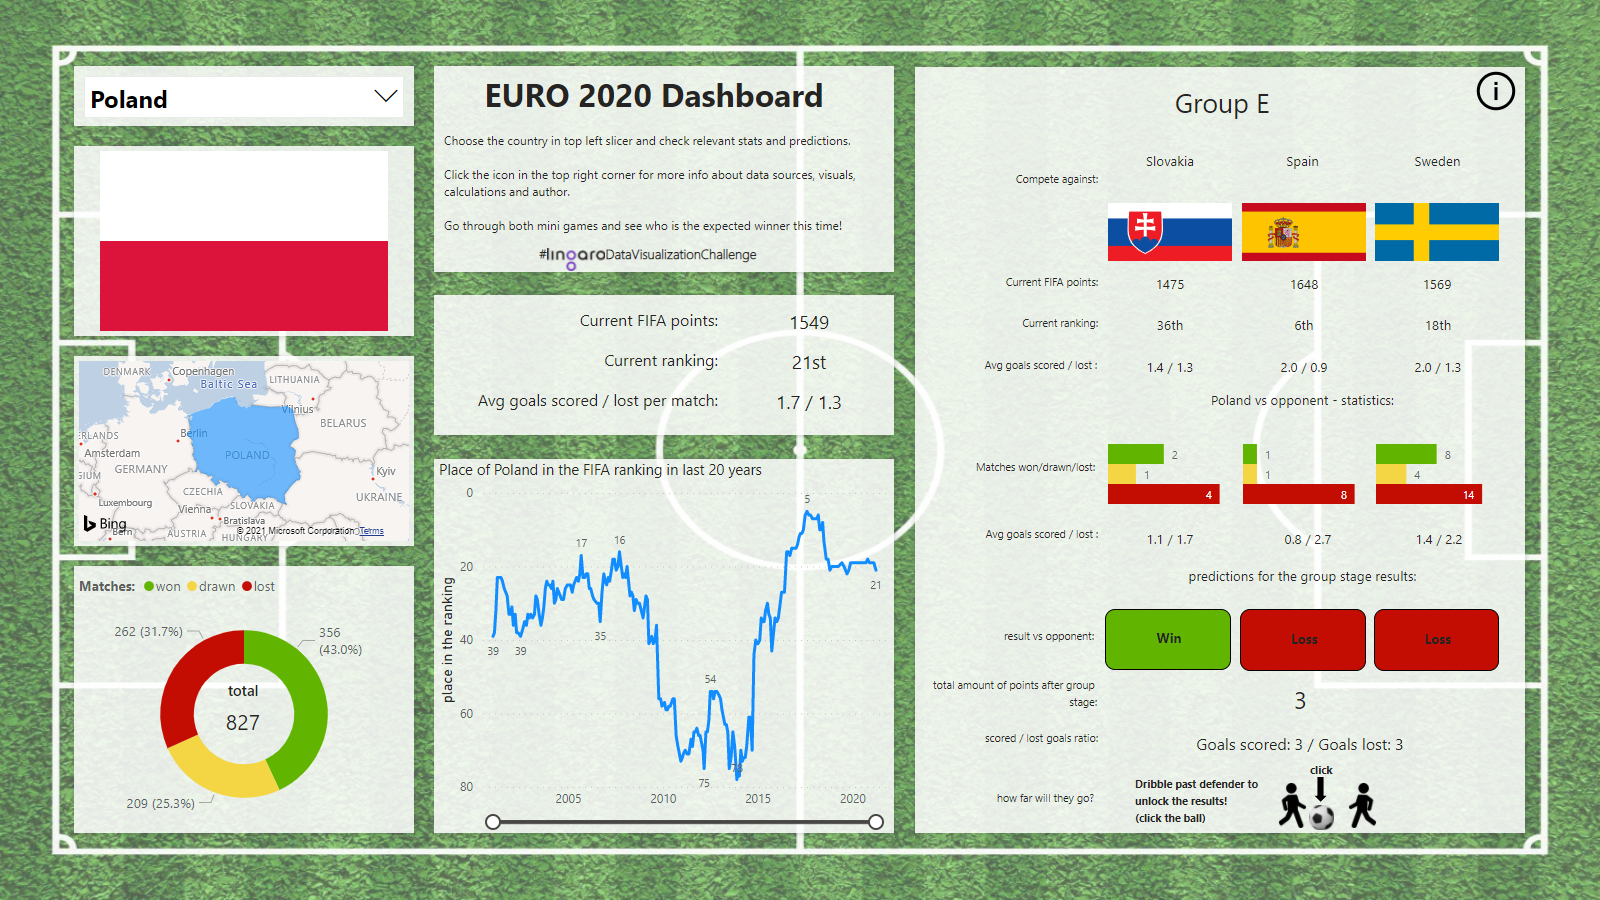
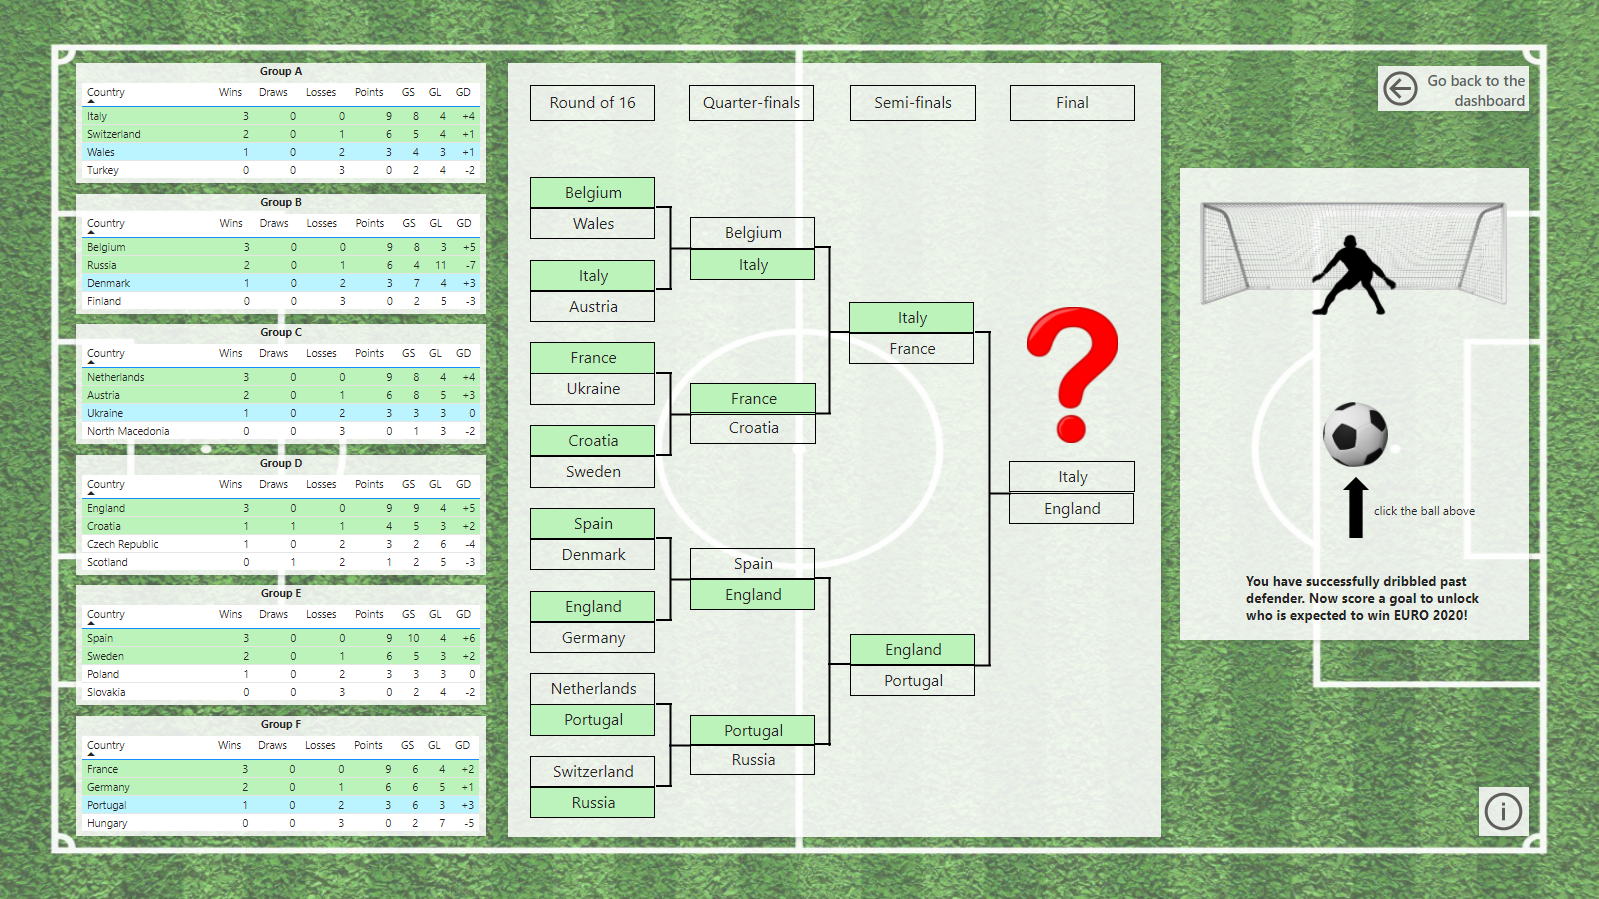
EURO 2020 Data Visualization Challenge
In my opinion the most difficult task in creating any contest dashboard is to balance two factors - visual attractiveness and meaningful calculations. Focusing on only one of these aspects will always lead to failure, for example who will remember a beautifully created dashboard, but without any single interesting insight or attempt to solve any problem? On the other hand, even a brilliant solution or thoughtful analysis without making it appealing and well-presented will discourage the viewer from reading the entire story.
Having that in my mind, I tried not to neglect any of these aspects and provide a comprehensive experience to the viewer. First of all, I wanted to visually crystallize that this dashboard is about football – we have a sports field in the background and flags corresponding to each country. Secondly, I wanted to engage the viewer by some mini games which are required to complete in order to reveal the next part of the story. All of that is interspersed with statistics and predictions (including a forecast who is going to win EURO 2020 as a cherry on top). For those who are inquisitive there are descriptions for applied measures.
eyJrIjoiNTg5MDJmZTEtOWVlYS00ZjNmLTkzNzUtYTg1N2JiM2EzNDMwIiwidCI6IjJlZTU0OGUxLTZiZTgtNDcyOS1iODZlLWY0ODJlMjlkMmM5ZiIsImMiOjh9
- Mark as New
- Bookmark
- Subscribe
- Mute
- Subscribe to RSS Feed
- Permalink
- Report Inappropriate Content
Hi,
how can we download the powerbi file for this dashboard?