FabCon is coming to Atlanta
Join us at FabCon Atlanta from March 16 - 20, 2026, for the ultimate Fabric, Power BI, AI and SQL community-led event. Save $200 with code FABCOMM.
Register now!- Power BI forums
- Get Help with Power BI
- Desktop
- Service
- Report Server
- Power Query
- Mobile Apps
- Developer
- DAX Commands and Tips
- Custom Visuals Development Discussion
- Health and Life Sciences
- Power BI Spanish forums
- Translated Spanish Desktop
- Training and Consulting
- Instructor Led Training
- Dashboard in a Day for Women, by Women
- Galleries
- Data Stories Gallery
- Themes Gallery
- Contests Gallery
- QuickViz Gallery
- Quick Measures Gallery
- Visual Calculations Gallery
- Notebook Gallery
- Translytical Task Flow Gallery
- TMDL Gallery
- R Script Showcase
- Webinars and Video Gallery
- Ideas
- Custom Visuals Ideas (read-only)
- Issues
- Issues
- Events
- Upcoming Events
The Power BI Data Visualization World Championships is back! Get ahead of the game and start preparing now! Learn more
- Power BI forums
- Forums
- Get Help with Power BI
- DAX Commands and Tips
- Two tables(years), same structure, one relation, w...
- Subscribe to RSS Feed
- Mark Topic as New
- Mark Topic as Read
- Float this Topic for Current User
- Bookmark
- Subscribe
- Printer Friendly Page
- Mark as New
- Bookmark
- Subscribe
- Mute
- Subscribe to RSS Feed
- Permalink
- Report Inappropriate Content
Two tables(years), same structure, one relation, what function is used in this case?
Good morning. I have a problem to solve, if you can help me. I have two tables (different year: 2018-2019) with the same structure. I have two important variables in each of those tables : Clients and year. I want to identify two groups :
The clients that come again in 2019 and classify them as continuators
Customers who do not come in 2019 : classify them as lost.
Any idea how? Thank you very much.
Solved! Go to Solution.
- Mark as New
- Bookmark
- Subscribe
- Mute
- Subscribe to RSS Feed
- Permalink
- Report Inappropriate Content
Hi,
It was quite fun to solve your Problem.
At First two sample Tables based on your Information.
The Data Inside of the Tables.
Then I build up a new calculated Table I call it Clients. With all Unique Clients as the first Column with this Dax Code.
Clients = DISTINCT(UNION(ALLSELECTED('Client-Year2018'[Client]);ALLSELECTED('Client-Year2019'[Client])))
After that you can calculate for each unique Client if it present or not with the Dax Code below in a new Calculated column.
I Modified it a bit to know if a customer comes new in 2019.
Classification =

var present2018 = LOOKUPVALUE('Client-Year2018'[Client]; 'Client-Year2018'[Client]; Clients[Client])
var present2019 = LOOKUPVALUE('Client-Year2019'[Client]; 'Client-Year2019'[Client]; Clients[Client])
Return
IF(present2018 = Clients[Client] && present2019 = Clients[Client]; "continuators"; IF(present2018 = Clients[Client] && NOT(present2019 = Clients[Client]); "Lost"; IF(NOT(present2018 = Clients[Client]) && present2019 = Clients[Client]; "New")))
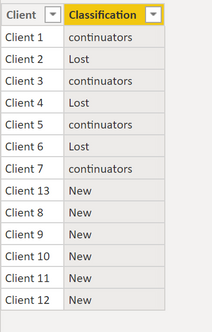
The new Table looks like this.
I hope this will help.
-------------------------------------------------------------------
Did I answer your question? Mark my post as a solution!
It was useful? Press Thumbs Up!
- Mark as New
- Bookmark
- Subscribe
- Mute
- Subscribe to RSS Feed
- Permalink
- Report Inappropriate Content
Thank you. Very thankful
Helpful resources

Power BI Dataviz World Championships
The Power BI Data Visualization World Championships is back! Get ahead of the game and start preparing now!

Power BI Monthly Update - November 2025
Check out the November 2025 Power BI update to learn about new features.

| User | Count |
|---|---|
| 20 | |
| 11 | |
| 10 | |
| 4 | |
| 4 |
| User | Count |
|---|---|
| 34 | |
| 32 | |
| 19 | |
| 12 | |
| 10 |


