Join us at FabCon Vienna from September 15-18, 2025
The ultimate Fabric, Power BI, SQL, and AI community-led learning event. Save €200 with code FABCOMM.
Get registered- Power BI forums
- Get Help with Power BI
- Desktop
- Service
- Report Server
- Power Query
- Mobile Apps
- Developer
- DAX Commands and Tips
- Custom Visuals Development Discussion
- Health and Life Sciences
- Power BI Spanish forums
- Translated Spanish Desktop
- Training and Consulting
- Instructor Led Training
- Dashboard in a Day for Women, by Women
- Galleries
- Data Stories Gallery
- Themes Gallery
- Contests Gallery
- Quick Measures Gallery
- Notebook Gallery
- Translytical Task Flow Gallery
- TMDL Gallery
- R Script Showcase
- Webinars and Video Gallery
- Ideas
- Custom Visuals Ideas (read-only)
- Issues
- Issues
- Events
- Upcoming Events
Compete to become Power BI Data Viz World Champion! First round ends August 18th. Get started.
- Power BI forums
- Forums
- Get Help with Power BI
- DAX Commands and Tips
- Re: Rollup of features %complete
- Subscribe to RSS Feed
- Mark Topic as New
- Mark Topic as Read
- Float this Topic for Current User
- Bookmark
- Subscribe
- Printer Friendly Page
- Mark as New
- Bookmark
- Subscribe
- Mute
- Subscribe to RSS Feed
- Permalink
- Report Inappropriate Content
Rollup of features %complete
Hi Team,
I was able to calculate %Complete of a feature based on state of a user story (2 tier feature and its user stories). But my requirements changed and now they want %Complete rolleup calculated for a feature based on all child items under a feature based on their state(Multi tier). To achieve this %Complete i created a master table which contains Feature Id's
%Completed = DIVIDE ( CALCULATE ( COUNTA ( 'data'[State] ),FILTER ('data', OR ( 'data'[State] = "Done", 'data'[State] ="Removed")&& [Parent ID] = EARLIER ( 'Table'[Parent ID] ))),
CALCULATE (COUNTA ( 'data'[State] ),FILTER ( data, [Parent ID] = EARLIER ( 'Table'[Parent ID] ) ) ) + 0)
Sample Data :
Example Data:
| Title | WorkItem Type | WorkItemID | ParentID | State |
| SS and MRC | Feature | 959585 | Test | |
| LED breath during SS and MRC | Story | 959587 | 959585 | Ready |
| DCR approval | Task | 959594 | 959587 | Done |
| focus test | Task | 959590 | 959587 | Done |
| POC approval | Task | 959592 | 959587 | Dev |
| Test Plan | Task | 959589 | 959587 | Done |
| AMD Feature | Feature | 884930 | Done | |
| Project 1 | Story | 913921 | 884930 | Done |
| Project 2 | Story | 887331 | 884930 | Done |
| Project 3 | Story | 884775 | 884930 | Done |
| Debug Brd | Feature | 960499 | Ready | |
| intermittent | Story | 976478 | 960499 | Done |
| Status byte | Story | 995998 | 960499 | Dev |
| data entry | Story | 964625 | 960499 | Ready |
| Team development | Story | 982739 | 960499 | Done |
| receiving data | Story | 964364 | 960499 | Removed |
| through packet | Story | 964368 | 960499 | Blocked |
| using RWE | Story | 964374 | 960499 | Test |
| address display | Story | 886369 | 960499 | Ready |
| successfully received | Story | 952654 | 960499 | Demo |
| successfully received Task | Task | 952653 | 952654 | Done |
| connection is active | Story | 952652 | 960499 | Ready |
| connection is active task | Task | 952651 | 952652 | Dev |
| 22PI2 Bugs | Feature | 926133 | Ready | |
| via FUR. | Bug | 936900 | 926133 | Done |
| Hep Inactive Tests | Bug | 940835 | 926133 | Dev |
| Magnet platform | Bug | 947686 | 926133 | Ready |
| Notify user | Bug | 966115 | 926133 | Done |
| Check in Git branch | Task | 960347 | 966115 | Removed |
| check in Git trunk | Task | 959717 | 966115 | Blocked |
| testing mode | Story | 960979 | 926133 | Test |
| Task 1 | Task | 960980 | 960979 | Ready |
| Task 2 | Task | 960981 | 960979 | Demo |
| Task 3 | Task | 960982 | 960979 | Done |
| Task 4 | Task | 960983 | 960979 | Ready |
| Task 5 | Task | 960984 | 960979 | Dev |
Expected Results:
| Feature | State | %Complete |
| SS and MRC | Test | 60 |
| AMD Feature | Done | 100 |
| Debug Brd | Ready | 25 |
| 22PI2 Bugs | Ready | 23 |
Solved! Go to Solution.
- Mark as New
- Bookmark
- Subscribe
- Mute
- Subscribe to RSS Feed
- Permalink
- Report Inappropriate Content
@Anonymous
OK. It's NOT elegant, but it works.
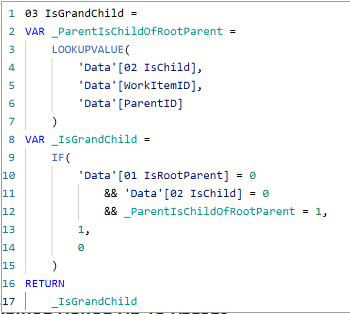
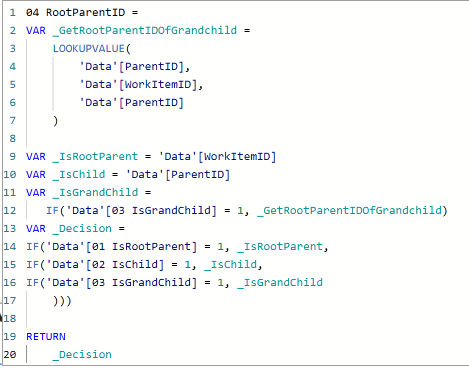
1) In the 'Data' table, create 4 calculated columns as follows.
- These 4 calculated columns serve to assign items across ALL 3 generations to the same "RootParentID".
- In other words, whether RootParentID, Children, or Grandchildren, all items will be assigned the same "RootParentID" for each family.
- This is the "hack" workaround we are doing to create "RootParentID" which (if following best practices), should already be present in the database.
After creating these 4 columns, the data looks like this. See how ALL generations within the same family are assigned the same RootParentID.
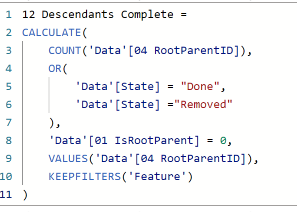
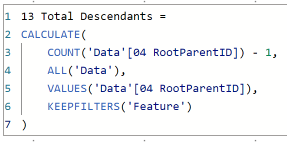
2) Now that the "Family Groups" (aka "RootParentID") are present in the data, we can proceed to the calculation. Create the following 3 measures in the 'Feature' table.
- Note1: you can combine all 3 measures into a single measure, using VARs. However, I split it out to show what is happening in the table visual.
- Note2: You can ignore the number within each measure name. (This is just an arbitrary numbering system I use to keep my measures in order.)
I believe this should give you the solution requested.
For additional reference, here is a link to my PBIX folder.
You just need the 1 file: "2022.08.07 Rollup of Features Percent Complete"
https://drive.google.com/drive/folders/13HqZmd_S7YEcTLWUr2txNN-7ysRug3ZX?usp=sharing
Regards,
Nathan
P.S. As you can see from my code, I am only looking for 3 generations. Code would need to be modified if you have families with more than 3 generations (i.e. great-granchildren or great-great-grandchildren etc.). But again, this type of calculation is NOT something that should be done in PBI. You need to have your DBA create a "RootParentID" in the database table and populate it for ALL records. Then you simply use it in PBI.
- Mark as New
- Bookmark
- Subscribe
- Mute
- Subscribe to RSS Feed
- Permalink
- Report Inappropriate Content
Additional troubleshooting notes:
- Even after summarizing the data into a new table (with only 3 columns), I was still getting the same error message, which implied there were still duplicates. I could not figure out why for some time, since the extra columns were removed and the 38 problematic rows did not immediately stand out to me out of 4000+ rows.
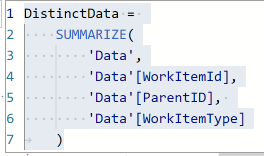
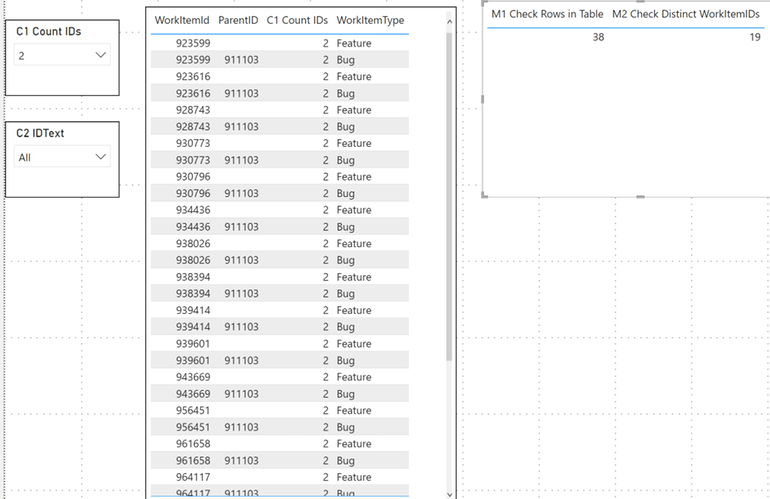
- To do an absolute check for duplicate values, I created the following 2 measures for the summarized table.
If these 2 measures match perfectly, then no duplicates exist.
However, when I pulled these 2 measures onto a table visual, I could see that they did NOT match.
To isolate the duplicate IDs, I created the following calculated column in the summarized table, and used it in a slicer to select IDs which appear 2 times.
Selecting value "2" from the slicer isolated the 38 problematic rows, where each of the 19 IDs is both a Feature (with no ParentID) as well as a Bug (with a ParentID).
Hopefully these steps are helpful to you.
Regards,
Nathan
- Mark as New
- Bookmark
- Subscribe
- Mute
- Subscribe to RSS Feed
- Permalink
- Report Inappropriate Content
@Anonymous
Yes! That was the problem.
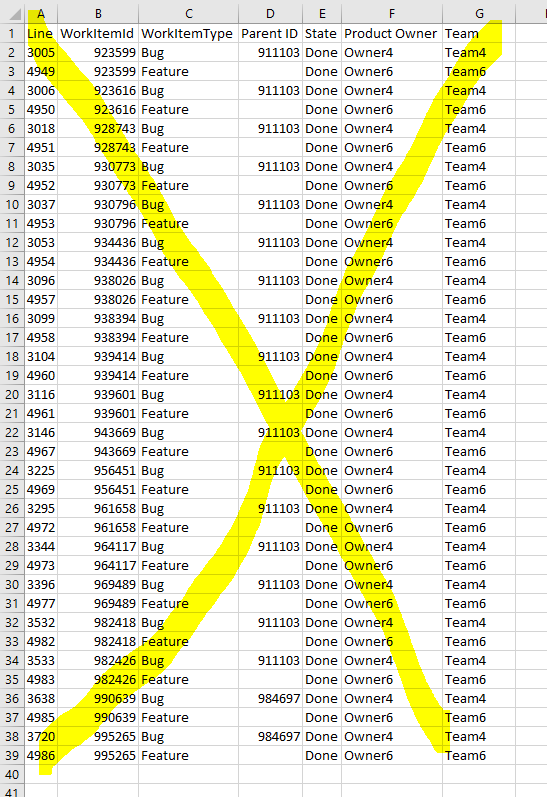
I removed those 38 rows where the same 19 WorkItemID values were assigned to both a Feature and a Bug. This is bad data.
As soon as those 38 rows were removed, I was able to create all 4 calculated columns no problem within the PBIX using your CSV.
Here again are the 38 rows that needed to be removed.
So I was wrong earlier.
We're not getting true duplicates due to adding the new columns.
We're getting true duplicates because the same WorkItemIDs are being used for multiple items.
This should never happen.
Regards,
Nathan
- Mark as New
- Bookmark
- Subscribe
- Mute
- Subscribe to RSS Feed
- Permalink
- Report Inappropriate Content
@Anonymous
In the CSV you gave me, it happens 19 times where the same WorkItemID belongs to both a Feature & a Bug.
This doesn't seem right.
I would think that each WorkItemID (for example, 923599) could only be either a Feature OR a Bug, and NOT both.
Am I mistaken?
Regards,
Nathan
- Mark as New
- Bookmark
- Subscribe
- Mute
- Subscribe to RSS Feed
- Permalink
- Report Inappropriate Content
@Anonymous
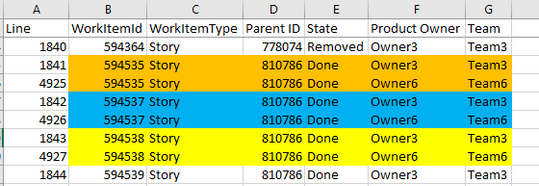
The problem is due to duplicates.
- The first dataset had none.
- The second dataset has them, because we added columns [Product Owner] & [Team].
- Here are 3 (of many) examples in the CSV:
- LOOKUPVALUE function only deals with scalar values.
- However, since there are now duplicates, LOOKUPVALUE doesn't work, because when it goes to lookup 1 value, it gets a table of values (multiple of the same).
1) Normally, this can be solved by using DAX provided in this blog.
However, for some reason, it's not working.
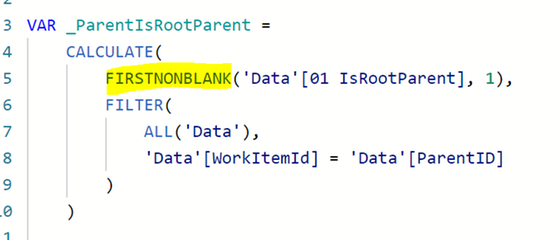
2) I also tried summarizing the 3 columns (to get distinct values) as a VAR and passing that into the LOOKUPVALUE, but that doesn't work.
3) The only other thought that occurred to me so far would be to create another table, summarizing the 3 columns ([01 IsRootParent], [WorkItemID], [ParentID]), which would ensure unique values. But this should not be necessary, and is not best practice.
So I am still investigating.
Regards,
Nathan
- Mark as New
- Bookmark
- Subscribe
- Mute
- Subscribe to RSS Feed
- Permalink
- Report Inappropriate Content
Hi @WinterMist
what i observed was if i remove or filter out WorkItemType Tasks then your solution works fine. Not sure what is the issue
- Mark as New
- Bookmark
- Subscribe
- Mute
- Subscribe to RSS Feed
- Permalink
- Report Inappropriate Content
@Anonymous
1) So a CSV will not ensure that everything else is set up the same. I might be able to reproduce & I might not. Is it not possible to share a PBIX? If not, I'll give the CSV a try.
2) To share on PBI forums, I find it is best to upload to Google Drive, and then share the link here.
Regards,
Nathan
- Mark as New
- Bookmark
- Subscribe
- Mute
- Subscribe to RSS Feed
- Permalink
- Report Inappropriate Content
@WinterMist sorry i will not be able to share the pbix but uploaded the csv here https://drive.google.com/drive/folders/1HFmwtuRu8q7K0LEwVkIku0YYosrg2I45
- Mark as New
- Bookmark
- Subscribe
- Mute
- Subscribe to RSS Feed
- Permalink
- Report Inappropriate Content
Hello @Anonymous -
No need to apologize! Hope you are well.
Point #1
In this case, I don't think the code is the problem. However, when sharing code, it is very helpful to format it for readability.
Unformatted
Formatted
Although there appears to be nothing wrong with the code, it still took me an extra few minutes to retype & format it to check for any code errors. Not the end of the world, but it's a nice thing to do up front when sharing code.
Point #2
DAX can be frustrating because the same code can work on one dataset/model and not on another.
In this case, it's hard to say why you're getting that error without access to your data.
Are you able to share the PBIX, or at the least, a PBIX with a larger testing dataset? I need to be able to replicate the error on your dataset (or a subset of it) before I can understand the problem to fix it.
Regards,
Nathan
- Mark as New
- Bookmark
- Subscribe
- Mute
- Subscribe to RSS Feed
- Permalink
- Report Inappropriate Content
- Mark as New
- Bookmark
- Subscribe
- Mute
- Subscribe to RSS Feed
- Permalink
- Report Inappropriate Content
@Anonymous
OK. It's NOT elegant, but it works.
1) In the 'Data' table, create 4 calculated columns as follows.
- These 4 calculated columns serve to assign items across ALL 3 generations to the same "RootParentID".
- In other words, whether RootParentID, Children, or Grandchildren, all items will be assigned the same "RootParentID" for each family.
- This is the "hack" workaround we are doing to create "RootParentID" which (if following best practices), should already be present in the database.
After creating these 4 columns, the data looks like this. See how ALL generations within the same family are assigned the same RootParentID.
2) Now that the "Family Groups" (aka "RootParentID") are present in the data, we can proceed to the calculation. Create the following 3 measures in the 'Feature' table.
- Note1: you can combine all 3 measures into a single measure, using VARs. However, I split it out to show what is happening in the table visual.
- Note2: You can ignore the number within each measure name. (This is just an arbitrary numbering system I use to keep my measures in order.)
I believe this should give you the solution requested.
For additional reference, here is a link to my PBIX folder.
You just need the 1 file: "2022.08.07 Rollup of Features Percent Complete"
https://drive.google.com/drive/folders/13HqZmd_S7YEcTLWUr2txNN-7ysRug3ZX?usp=sharing
Regards,
Nathan
P.S. As you can see from my code, I am only looking for 3 generations. Code would need to be modified if you have families with more than 3 generations (i.e. great-granchildren or great-great-grandchildren etc.). But again, this type of calculation is NOT something that should be done in PBI. You need to have your DBA create a "RootParentID" in the database table and populate it for ALL records. Then you simply use it in PBI.
- Mark as New
- Bookmark
- Subscribe
- Mute
- Subscribe to RSS Feed
- Permalink
- Report Inappropriate Content
Hi @WinterMist
sorry to Bug but i am receving follwoing error when using the Dax provided. Not Sure what i am doing wrong, my table has all workitemtypes, when i apply fiilter in my dataset to have only Features,Bugs,Stories then i dont see this error
- Mark as New
- Bookmark
- Subscribe
- Mute
- Subscribe to RSS Feed
- Permalink
- Report Inappropriate Content
Thank you so much for your response. This solution looks promissing, i will try this and let you know.
I am pulling the data from Azure Devops so i dont think we can create "RootParentID". So, i guess this is something that we need to do in BI.
- Mark as New
- Bookmark
- Subscribe
- Mute
- Subscribe to RSS Feed
- Permalink
- Report Inappropriate Content
@Anonymous
OK, I think I am beginning to understand.
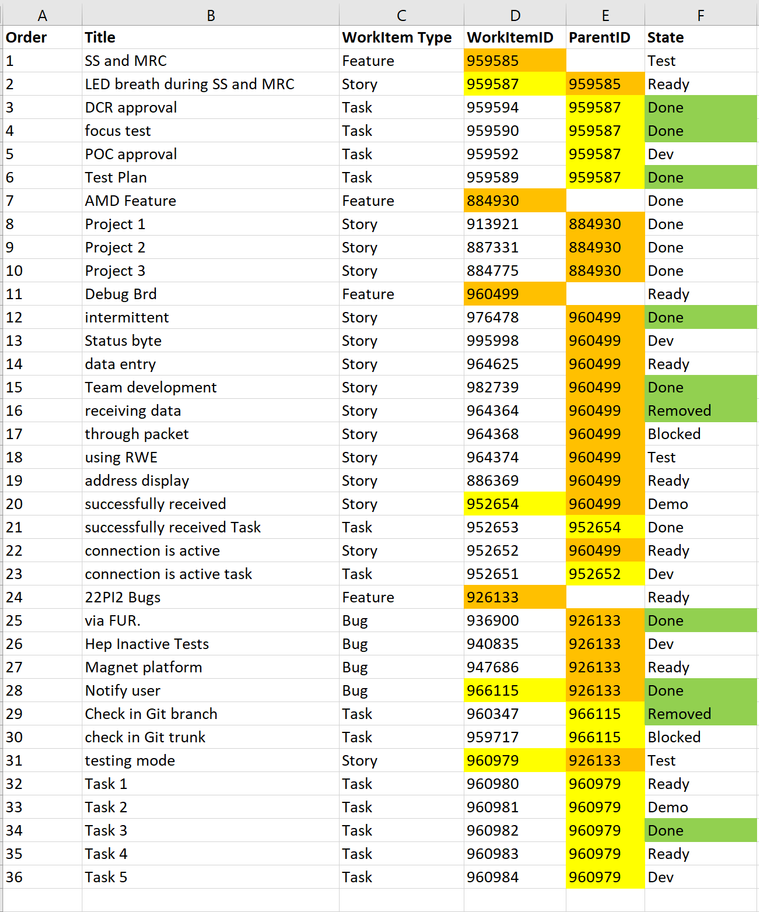
You are wanting to count all descendents of each feature; children as well as grandchildren.
- Orange links RootParent to Child
- Yellow links Child to Grandchild
- Green qualifies as Done/Removed (towards %Complete)
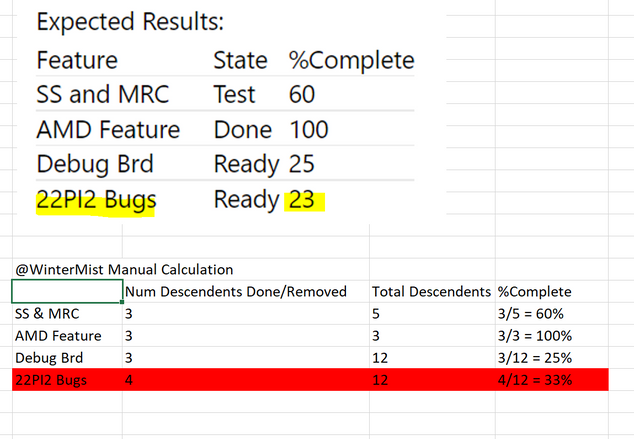
My manual calculations match your "Expected Results" for each feature except "22PI2 Bugs".
- You get 23%
- I get 33% (4 / 12 = 33%)
Can you show me where I'm getting confused on this one?
1) First, let me know how I am messing up the calculation above for "22PI2 Bugs"
2) Any time you have more than 2 generations in a family of items, which need to be grouped by the entire family, it is best practice to have a RootParentID column in the database. Is it possible that you can speak to the DBA to pull in the RootParentID so you can use it in PBI. With RootParentID, we can group ALL GENERATIONS in a single step. Without RootParentID from the database, we have do "hack" workarounds in Power BI, which is not good.
For example:
Generation 1) RootParentID for a Feature = [its own WorkItem ID]
Generation 2) RootParentID for children = [ParentID]
Generation 3) RootParentID for grandchildren = [ParentID of its ParentID]
If it is not possible to get RootParentID from the database into PBI (for example, because it does not exist), then what is the maximum number of generations possible in a family? In these 4 examples, I only see 3 generations. But are there families which have 4 or 5 generations in your data?
Regards,
Nathan
- Mark as New
- Bookmark
- Subscribe
- Mute
- Subscribe to RSS Feed
- Permalink
- Report Inappropriate Content
Hello @Anonymous -
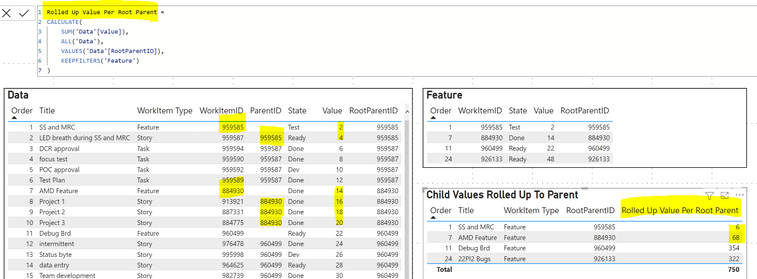
Since I am not able to apply your calculated column on the 'Data' table to get values for the children items, I simply created manual arbitrary values in Excel in the newly added "Value" column.
Any time you want to roll up parent + child values into 1 single row for the parent, it can be done with the following steps:
1) Create a calculated column "RootParentID".
This is to ensure that all rows get an ID value.
For example, the Features (parent items) all show ParentID as NULL.
But this is not helpful. We need all items to have the ParentID by which we can group families together.
2) Ensure that the relationship is properly established between the 2 tables, correctly linking all items in the family (within the Data table) to the 1 RootParentID (within the Feature table).
3) Finally, create the following measure "Rolled Up Value Per Root Parent".
Again, my apologies for not understanding how you are getting your values calculated on the child items.
But it doesn't really matter.
The same logic above works any time you want to roll up all values within a given family onto the parent row.
Hope this is helpful to you!
Regards,
Nathan
- Mark as New
- Bookmark
- Subscribe
- Mute
- Subscribe to RSS Feed
- Permalink
- Report Inappropriate Content
Hi @WinterMist
Thankyou for your response. I unserstand that you are using the value column to do the rollup but i guess i am not sure on how to apply that to get the %Complete for each feature based on the child items state (Done or Removed). Out of 10 child items if 2 of them are complete then the Feature %complete is 20%
- Mark as New
- Bookmark
- Subscribe
- Mute
- Subscribe to RSS Feed
- Permalink
- Report Inappropriate Content
Can someone please help me with the request ? I need this request to be completed asap
- Mark as New
- Bookmark
- Subscribe
- Mute
- Subscribe to RSS Feed
- Permalink
- Report Inappropriate Content
@Anonymous
Thanks for that.
I was able to add the column to the 'Feature' table (Parent Items Only), and not to the main 'Data' table (Parent & Child items together).
Something is confusing me however.
Since there is no %Complete in the main 'Data' table (on the child level), how can child values which do not exist be rolled up to the parent?
It seems like %Complete needs to be added to the main 'Data' table.
(After the data is there on the child level, the entire family can then be rolled up to the parent.)
But when I try to add the calculated column to the 'Data' table, I get the common error that "a single value for [column] in [table] cannot be determined.
Regards,
Nathan
- Mark as New
- Bookmark
- Subscribe
- Mute
- Subscribe to RSS Feed
- Permalink
- Report Inappropriate Content
@Anonymous
@amitchandak is already helping you, and he's one of the best!
But maybe you can help me figure out what I'm doing wrong in replicating what you have?
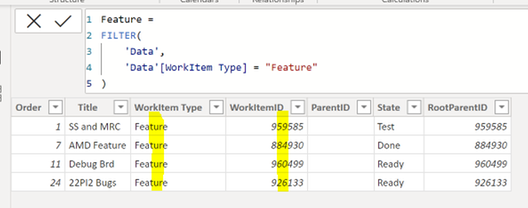
1) I created the second table called "Feature", which only includes the Feature rows.
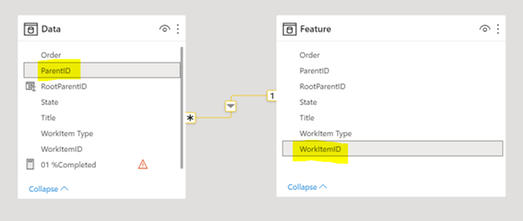
2) I then linked the 2 tables together as follows:
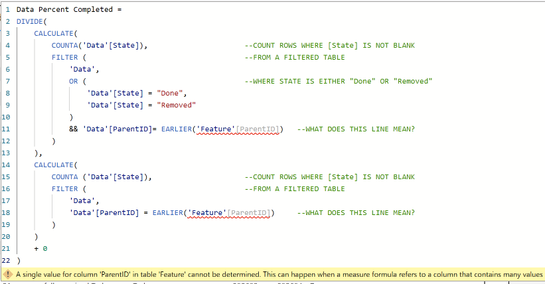
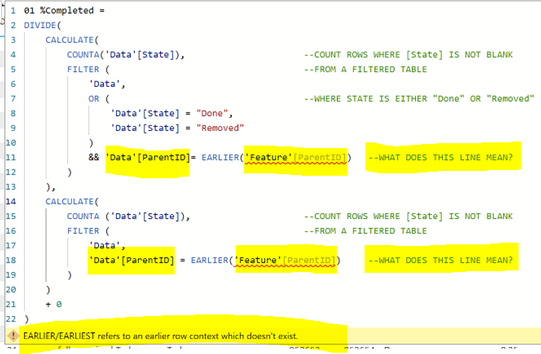
3) Finally, I attempted to implement your measure on the provided dataset, but am getting an error. Can you tell me what I'm doing wrong?
Part of the problem is I don't understand what this line is supposed to do.
&& 'Data'[ParentID] = EARLIER('Feature'[ParentID])
Thanks in advance for educating me.
Regards,
Nathan
- Mark as New
- Bookmark
- Subscribe
- Mute
- Subscribe to RSS Feed
- Permalink
- Report Inappropriate Content
Hi @WinterMist
You need to create a Column instead of measure and that should fix the issue that you have.
- Mark as New
- Bookmark
- Subscribe
- Mute
- Subscribe to RSS Feed
- Permalink
- Report Inappropriate Content
@Anonymous , Try a measure like
%Completed = DIVIDE ( CALCULATE ( COUNTA ( 'data'[State] ),FILTER (allselected('data'), OR ( 'data'[State] = "Done", 'data'[State] ="Removed")
&& [Parent ID] = max ( 'Table'[Parent ID] ))),
CALCULATE (COUNTA ( 'data'[State] ),FILTER ( allselected('data'), [Parent ID] = max ( 'Table'[Parent ID] ) ) ) ,0)
Helpful resources
| User | Count |
|---|---|
| 17 | |
| 8 | |
| 7 | |
| 6 | |
| 6 |
| User | Count |
|---|---|
| 26 | |
| 13 | |
| 12 | |
| 9 | |
| 8 |


