FabCon is coming to Atlanta
Join us at FabCon Atlanta from March 16 - 20, 2026, for the ultimate Fabric, Power BI, AI and SQL community-led event. Save $200 with code FABCOMM.
Register now!- Power BI forums
- Get Help with Power BI
- Desktop
- Service
- Report Server
- Power Query
- Mobile Apps
- Developer
- DAX Commands and Tips
- Custom Visuals Development Discussion
- Health and Life Sciences
- Power BI Spanish forums
- Translated Spanish Desktop
- Training and Consulting
- Instructor Led Training
- Dashboard in a Day for Women, by Women
- Galleries
- Data Stories Gallery
- Themes Gallery
- Contests Gallery
- Quick Measures Gallery
- Notebook Gallery
- Translytical Task Flow Gallery
- TMDL Gallery
- R Script Showcase
- Webinars and Video Gallery
- Ideas
- Custom Visuals Ideas (read-only)
- Issues
- Issues
- Events
- Upcoming Events
To celebrate FabCon Vienna, we are offering 50% off select exams. Ends October 3rd. Request your discount now.
- Power BI forums
- Forums
- Get Help with Power BI
- DAX Commands and Tips
- Ranking of items in 3 subcategories
- Subscribe to RSS Feed
- Mark Topic as New
- Mark Topic as Read
- Float this Topic for Current User
- Bookmark
- Subscribe
- Printer Friendly Page
- Mark as New
- Bookmark
- Subscribe
- Mute
- Subscribe to RSS Feed
- Permalink
- Report Inappropriate Content
Ranking of items in 3 subcategories
Hi,
I need some measurements to get the ranking of the different items within some subcategories (Area/Product/Article), and also the top ranked item in each ranking. The ranking in a given subcategory must be filtered by the top ranked item in the upper one.
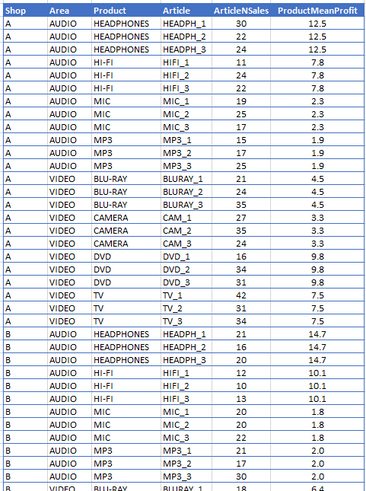
This is the sample dataset. There are 2 items in Area, 4 Products within each Area, and 3 different Articles for each Product:
For example, if the top ranked Area is Audio, I need to know the top ranked audio Product (from Headphones, Hi-Fi, Mic, MP3), and for this product (let's say for example Headphones) the top ranked article (from Headph_1, Headph_2 and Headph_3 in this case).
I have to show the 3 rankings in 3 separate tables or matrices, and the top ranked items in cards.
Area, Product and Article must be ranked by sum of ArticleNSales, ProductMeanProfit and ArticleNSales, respectively.
Here the link to the file, thanks in advance!
https://drive.google.com/file/d/1a1JiGPPiPrqn_1zTMOJbYe7YaGBWRK8r/view?usp=sharing
Solved! Go to Solution.
- Mark as New
- Bookmark
- Subscribe
- Mute
- Subscribe to RSS Feed
- Permalink
- Report Inappropriate Content
Creating the right measures is not as simple as one might initially think.
Please find a solution attached.
Best
D
- Mark as New
- Bookmark
- Subscribe
- Mute
- Subscribe to RSS Feed
- Permalink
- Report Inappropriate Content
I ran out of time but did figure out an updated Product Rank measure. This one will return blank for any products that are not in the top area. The same approach could be used for an updated Article measure too. I see another solution is posted, so let me know if you still need that measure (or if this one doesn't meet the need).
Product Rank Top Area =
VAR areatotal =
CALCULATE (
SUM ( Sales[ArticleNSales] ),
ALL ( Sales[Product] ),
VALUES ( Sales[Area] )
)
VAR arearank =
COUNTROWS (
FILTER (
ALL ( Sales[Area] ),
CALCULATE ( SUM ( Sales[ArticleNSales] ), ALL ( Sales[Product] ) ) >= areatotal
)
)
RETURN
IF (
arearank = 1,
RANKX (
ALL ( Sales[Product] ),
CALCULATE (
SUM ( Sales[ProductMeanProfit] ),
FILTER ( VALUES ( Sales[Area] ), [Area Rank] = 1 )
),
,
DESC,
DENSE
),
BLANK ()
)
If this works for you, please mark it as solution. Kudos are appreciated too. Please let me know if not.
Regards,
Pat
Did I answer your question? Mark my post as a solution! Kudos are also appreciated!
To learn more about Power BI, follow me on Twitter or subscribe on YouTube.
@mahoneypa HoosierBI on YouTube
- Mark as New
- Bookmark
- Subscribe
- Mute
- Subscribe to RSS Feed
- Permalink
- Report Inappropriate Content
These three measures seem to do the trick in your pbix file -
If this works for you, please mark it as solution. Kudos are appreciated too. Please let me know if not.
Regards,
Pat
Did I answer your question? Mark my post as a solution! Kudos are also appreciated!
To learn more about Power BI, follow me on Twitter or subscribe on YouTube.
@mahoneypa HoosierBI on YouTube
- Mark as New
- Bookmark
- Subscribe
- Mute
- Subscribe to RSS Feed
- Permalink
- Report Inappropriate Content
Hi @mahoneypat
Thanks a lot for your response!
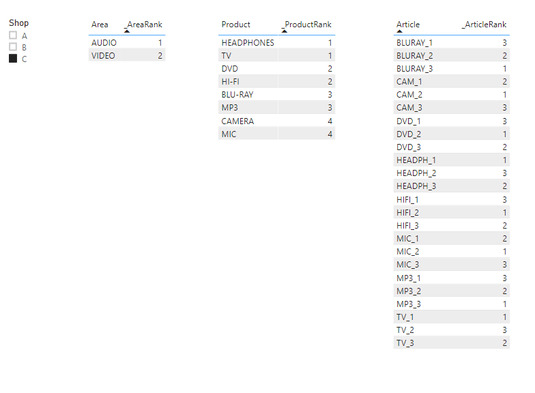
There is still a little step missing. The measures seems ok in the sense that they provide the rank separately for each subcategory, as needed. See the image:
The point is that in the second table I should see only the 4 products related to the first ranked Area: for the example in the image Headphones, Hi-Fi, MP3, MIC because the first ranked Area is AUDIO. And in the third table I should see just the 3 articles associated to the first ranked Product: in this case HEADPH_1, HEADPH_2, HEADPH_3.
I tried with the Top N visual filter, but I would need 2 of them in the Articles table and it is not allowed. There should be some solution using DAX.
And finally, how can I get the 3 first ranked items (Area, Product and Article) in three different cards, as explained in the original question?
Thanks again for your time!
- Mark as New
- Bookmark
- Subscribe
- Mute
- Subscribe to RSS Feed
- Permalink
- Report Inappropriate Content
I ran out of time but did figure out an updated Product Rank measure. This one will return blank for any products that are not in the top area. The same approach could be used for an updated Article measure too. I see another solution is posted, so let me know if you still need that measure (or if this one doesn't meet the need).
Product Rank Top Area =
VAR areatotal =
CALCULATE (
SUM ( Sales[ArticleNSales] ),
ALL ( Sales[Product] ),
VALUES ( Sales[Area] )
)
VAR arearank =
COUNTROWS (
FILTER (
ALL ( Sales[Area] ),
CALCULATE ( SUM ( Sales[ArticleNSales] ), ALL ( Sales[Product] ) ) >= areatotal
)
)
RETURN
IF (
arearank = 1,
RANKX (
ALL ( Sales[Product] ),
CALCULATE (
SUM ( Sales[ProductMeanProfit] ),
FILTER ( VALUES ( Sales[Area] ), [Area Rank] = 1 )
),
,
DESC,
DENSE
),
BLANK ()
)
If this works for you, please mark it as solution. Kudos are appreciated too. Please let me know if not.
Regards,
Pat
Did I answer your question? Mark my post as a solution! Kudos are also appreciated!
To learn more about Power BI, follow me on Twitter or subscribe on YouTube.
@mahoneypa HoosierBI on YouTube
- Mark as New
- Bookmark
- Subscribe
- Mute
- Subscribe to RSS Feed
- Permalink
- Report Inappropriate Content


