This time we’re going bigger than ever. Fabric, Power BI, SQL, AI and more. We're covering it all. You won't want to miss it.
Learn moreLevel up your Power BI skills this month - build one visual each week and tell better stories with data! Get started
Table 1 CustomerMaster:
| CustomerNumber | Customer Name |
| 100 | Apple |
| 101 | Microsoft |
Table 2, Open invoices in ERP:
| CustomerNumber | Invoice | Amount |
| 100 | 3 | 1000 |
| 100 | 4 | 2000 |
| 101 | 5 | 3000 |
Table 3, Open invoices InvoicePartner:
| CustomerNumber | Invoice | Amount |
| 100 | 3 | 1000 |
| 101 | 5 | 3000 |
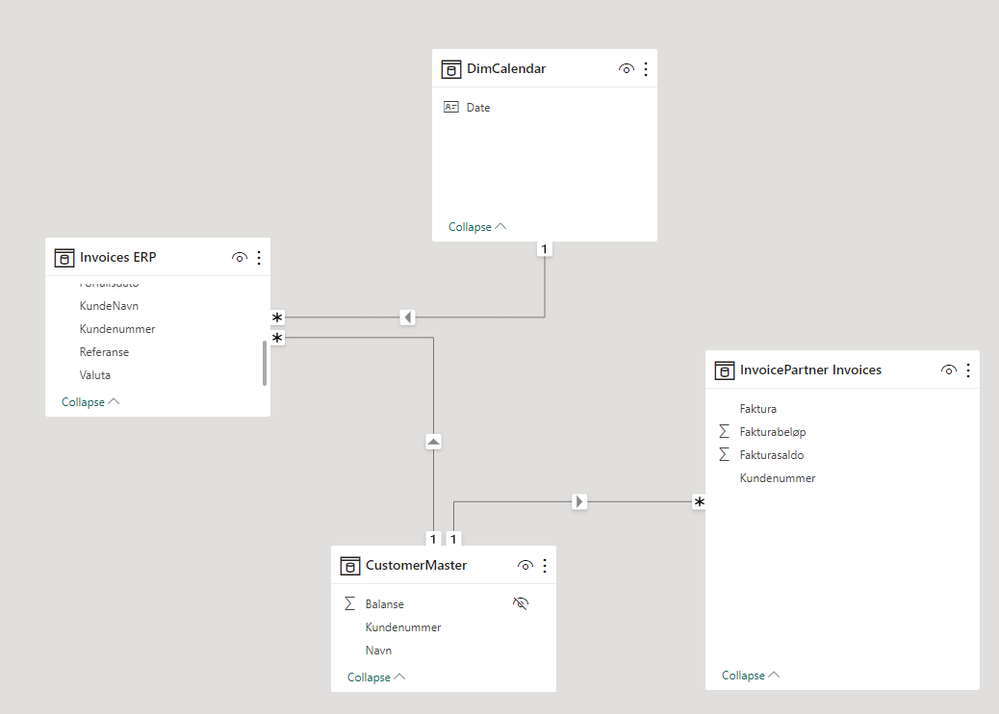
Relationship is on KundeNummer in each table.
I have a measure to calculate the difference of these two tables.
Measure is:
Difference = VAR _DIFF_CHECK = [SUM ERP]-[SUM InvoicePartner] Return IF(_DIFF_CHECK<>0, _DIFF_CHECK)
it returns this:
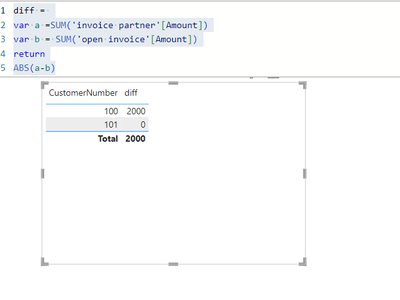
| CustomerNumber | Difference |
| 100 | 2000 |
| 101 | 0 |
How can i create a card visual/measure to say that number of customers with difference is 1?
i am not able to do a countIF(Difference<>0)
Solved! Go to Solution.
To create a card visual or measure that displays the number of customers with differences in the "Difference" measure, you can follow these steps:
CountOfCustomersWithDifferences = COUNTROWS(FILTER(CustomerMaster, [Difference] <> 0))
This measure counts the rows in the "CustomerMaster" table where the "Difference" measure is not equal to 0.
Add a card visual to your report.
In the card visual, use the "CountOfCustomersWithDifferences" measure as the value to display.
Now, your card visual will show the number of customers with differences in their invoices. If the "Difference" measure is not equal to 0 for a customer, it will be counted in this card visual. In your example data, it will show "1" because there is one customer with a difference (CustomerNumber 100).
To create a card visual or measure that displays the number of customers with differences in the "Difference" measure, you can follow these steps:
CountOfCustomersWithDifferences = COUNTROWS(FILTER(CustomerMaster, [Difference] <> 0))
This measure counts the rows in the "CustomerMaster" table where the "Difference" measure is not equal to 0.
Add a card visual to your report.
In the card visual, use the "CountOfCustomersWithDifferences" measure as the value to display.
Now, your card visual will show the number of customers with differences in their invoices. If the "Difference" measure is not equal to 0 for a customer, it will be counted in this card visual. In your example data, it will show "1" because there is one customer with a difference (CustomerNumber 100).
Check out the April 2026 Power BI update to learn about new features.
Sign up to receive a private message when registration opens and key events begin.
If you have recently started exploring Fabric, we'd love to hear how it's going. Your feedback can help with product improvements.
| User | Count |
|---|---|
| 5 | |
| 4 | |
| 3 | |
| 3 | |
| 3 |
| User | Count |
|---|---|
| 9 | |
| 8 | |
| 7 | |
| 6 | |
| 6 |