Join us at FabCon Vienna from September 15-18, 2025
The ultimate Fabric, Power BI, SQL, and AI community-led learning event. Save €200 with code FABCOMM.
Get registered- Power BI forums
- Get Help with Power BI
- Desktop
- Service
- Report Server
- Power Query
- Mobile Apps
- Developer
- DAX Commands and Tips
- Custom Visuals Development Discussion
- Health and Life Sciences
- Power BI Spanish forums
- Translated Spanish Desktop
- Training and Consulting
- Instructor Led Training
- Dashboard in a Day for Women, by Women
- Galleries
- Data Stories Gallery
- Themes Gallery
- Contests Gallery
- Quick Measures Gallery
- Notebook Gallery
- Translytical Task Flow Gallery
- TMDL Gallery
- R Script Showcase
- Webinars and Video Gallery
- Ideas
- Custom Visuals Ideas (read-only)
- Issues
- Issues
- Events
- Upcoming Events
Compete to become Power BI Data Viz World Champion! First round ends August 18th. Get started.
- Power BI forums
- Forums
- Get Help with Power BI
- DAX Commands and Tips
- Re: Need HELP with DAX please!
- Subscribe to RSS Feed
- Mark Topic as New
- Mark Topic as Read
- Float this Topic for Current User
- Bookmark
- Subscribe
- Printer Friendly Page
- Mark as New
- Bookmark
- Subscribe
- Mute
- Subscribe to RSS Feed
- Permalink
- Report Inappropriate Content
Need HELP with DAX please!
Hello All
I have a complex request to be able to select a sample of data for auditing based on user-selected dates.
What I want to be able to do is:
- Take the Date diff between the User-selected date and “Referral date”
- Calculates the weeks based on the step1. I.e. Total Days/7
- I need to Group step 2 to create a Week Range. So if the week between 0 && 1 then ‘0-1 Weeks’, Weeks between 1 && 2 then ‘’1-2 Weeks etc..
I am particularly struggling around Step 3, which I am trying to do it in a column as I would need this in to show the total customers by Weeks Range a clustered chart.
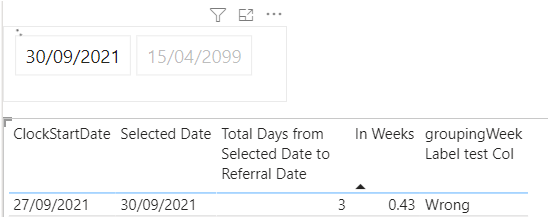
You can see above that Total Days from the selected date is working which is taking the date diff from the clockstartdate and User-selected date. In Weeks = Total Days/7.
Is it possible to create a Column that’s based on the “In weeks” measure to show this is ‘0-1 Weeks’ range ?
Any help would be much appreciated.
Solved! Go to Solution.
- Mark as New
- Bookmark
- Subscribe
- Mute
- Subscribe to RSS Feed
- Permalink
- Report Inappropriate Content
Hi, @Anonymous
This can be a little difficult if your model involves slicers.
You are using a calculated column instead of a measure, which will cause the result to be static(not recalculated based on your current filter context). If you use measure instead, the result will be correct, but you won't be able to apply it to the 'Axis' on the bar chart.
Best Regards,
Community Support Team _ Eason
- Mark as New
- Bookmark
- Subscribe
- Mute
- Subscribe to RSS Feed
- Permalink
- Report Inappropriate Content
Any help would be much appreciated guys! thank you
- Mark as New
- Bookmark
- Subscribe
- Mute
- Subscribe to RSS Feed
- Permalink
- Report Inappropriate Content
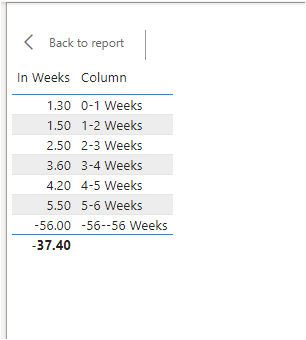
@tackytechtom I tried to replicate your logic in a Column but it showing me the wrong range, especially when you have -ve In Weeks figures - see below. Are you able to share your PBIX file please? @tackytechtom
- Mark as New
- Bookmark
- Subscribe
- Mute
- Subscribe to RSS Feed
- Permalink
- Report Inappropriate Content
- Mark as New
- Bookmark
- Subscribe
- Mute
- Subscribe to RSS Feed
- Permalink
- Report Inappropriate Content
@amitchandak thank you for your quick response. So your suggestion works fine in Measure. Is it possible to Group the Measure week into a range? For example say if the Measure week is returning 0.43, then Weeks Range as 0-1 Weeks?
I need this in a column so that I can create a clustered Chart, total customers by Week Range - something like below.
- Mark as New
- Bookmark
- Subscribe
- Mute
- Subscribe to RSS Feed
- Permalink
- Report Inappropriate Content
Hi @Anonymous ,
I have a first draft here:
The question is though what to do when it exactly hits a week (or a multiple of that, see 7 in picture). Should it then show 6-7 Weeks or 7-8 Weeks? You might be able to tweak the DAX below accordingly, but this might be a start for you:
TomsGroupingWeekTable =
ROUNDDOWN( Table[In Weeks], 0 ) & "-" & ROUNDUP( Table[In Weeks], 0 ) & " Weeks"
Let me know if you need further assistance!
/Tom
https://www.instagram.com/tackytechtom
| Did I answer your question❓➡️ Please, mark my post as a solution ✔️ |
| Also happily accepting Kudos 🙂 |
| Feel free to connect with me on LinkedIn! | |
| #proudtobeasuperuser |  |
- Mark as New
- Bookmark
- Subscribe
- Mute
- Subscribe to RSS Feed
- Permalink
- Report Inappropriate Content
@tackytechtom Well actually, I added a IF statement to deal with the -ve In Weeks figures but it didnt go well for other In Weeks figures.
You can see below, User selected date is 31/07/2021, based on that you can see there should be a range from 0-1 Weeks, 1-2 Weeks, and 2-3 Weeks etc.. but its shows as 0-1 Weeks for all.
This is my Dax code
@tackytechtom, not sure if I am missing something obvious, any help would be much appreciated.
Many thanks
- Mark as New
- Bookmark
- Subscribe
- Mute
- Subscribe to RSS Feed
- Permalink
- Report Inappropriate Content
Hi, @Anonymous
This can be a little difficult if your model involves slicers.
You are using a calculated column instead of a measure, which will cause the result to be static(not recalculated based on your current filter context). If you use measure instead, the result will be correct, but you won't be able to apply it to the 'Axis' on the bar chart.
Best Regards,
Community Support Team _ Eason
- Mark as New
- Bookmark
- Subscribe
- Mute
- Subscribe to RSS Feed
- Permalink
- Report Inappropriate Content
Thank you @v-easonf-msft .I suspect this might be the case. Would be good to enable this feature in the Power BI.
- Mark as New
- Bookmark
- Subscribe
- Mute
- Subscribe to RSS Feed
- Permalink
- Report Inappropriate Content
@Anonymous , Try measure like
Measure =
var _min = minx(allselected(Date),Date[Date])
return
Averagex(Table, datediff(Table[clock Start date], _min, day) )
Measure Week=
var _min = minx(allselected(Date),Date[Date])
return
Averagex(Table, datediff(Table[clock Start date], _min, day)/7 )
Helpful resources
| User | Count |
|---|---|
| 25 | |
| 10 | |
| 8 | |
| 7 | |
| 6 |
| User | Count |
|---|---|
| 32 | |
| 12 | |
| 10 | |
| 10 | |
| 9 |


