Become a Certified Power BI Data Analyst!
Join us for an expert-led overview of the tools and concepts you'll need to pass exam PL-300. The first session starts on June 11th. See you there!
Get registered- Power BI forums
- Get Help with Power BI
- Desktop
- Service
- Report Server
- Power Query
- Mobile Apps
- Developer
- DAX Commands and Tips
- Custom Visuals Development Discussion
- Health and Life Sciences
- Power BI Spanish forums
- Translated Spanish Desktop
- Training and Consulting
- Instructor Led Training
- Dashboard in a Day for Women, by Women
- Galleries
- Webinars and Video Gallery
- Data Stories Gallery
- Themes Gallery
- Contests Gallery
- Quick Measures Gallery
- Notebook Gallery
- Translytical Task Flow Gallery
- R Script Showcase
- Ideas
- Custom Visuals Ideas (read-only)
- Issues
- Issues
- Events
- Upcoming Events
Power BI is turning 10! Let’s celebrate together with dataviz contests, interactive sessions, and giveaways. Register now.
- Power BI forums
- Forums
- Get Help with Power BI
- DAX Commands and Tips
- How to use 2 slicers on the same table to populate...
- Subscribe to RSS Feed
- Mark Topic as New
- Mark Topic as Read
- Float this Topic for Current User
- Bookmark
- Subscribe
- Printer Friendly Page
- Mark as New
- Bookmark
- Subscribe
- Mute
- Subscribe to RSS Feed
- Permalink
- Report Inappropriate Content
How to use 2 slicers on the same table to populate yaxis and yaxis2
Hello everyone,
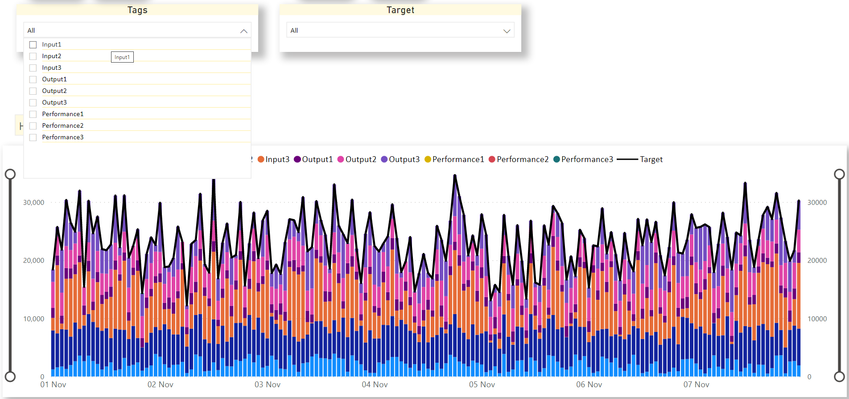
I have 2 slicers with all the field names in my table (unpivotted the data to be able to make a slicer for this). The idea is for one slicer to populate the y-axis and the other one populate y-axis2.
Here is the file with dummy data that replicates my issue.
For context, I have 3 tables for the same data, Hourly, Daily and Weekly. The real data has thousands of columns with many of them being complex formulas built in SQL, so this is required to prevent using Hourly average values for those performance formulas -- however that part is all working fine, and replicated in the Dummy file too.
Problem: Currently, I'm able to select anything on the 1st slicer and fill y-axis but this makes it so once I select anything in the 2nd slicer the graph goes blank (For instance, Input1+Output1 on yaxis and Performance1 on yaxis-2). I believe I'm missing something in my measures to ensure it looks up data despite the 1st slicer selection. I've tried duplicating the Attribute column (Field names) and use the copy on the 2nd slicer, tried playing around with the interaction between the slicers and tried including an ALL('Hourly') filter in my measure to ignore the slicer1 selected data but it didn't do what I wanted.
Bad workaround: Currently I have this working by creating a copy of my 3 tables, Hourly, Daily and Weekly and using the copy on the 2nd slicer which effectively doubles my file's size. As I need to create dozens of similar files refresh them frequently on a schedule I'm hoping I can get this working without copying all my data.
If there's anything else I can provide please let me know.
Solved! Go to Solution.
- Mark as New
- Bookmark
- Subscribe
- Mute
- Subscribe to RSS Feed
- Permalink
- Report Inappropriate Content
Hello,
I finally managed to resolve the issue. I'm now able to select any field from the left slicer into y-axis1 and from the right slicer into y-axis2 as a stacked line.
After having created 2 tables (TagList & TargetList) with the data's column names for the slicers I had to create a Many-to-Many relationship with a single filter going from the data to these new tables.
Thank you for taking the time, pbix file here if you'd like to look into it, marking as solution.
- Mark as New
- Bookmark
- Subscribe
- Mute
- Subscribe to RSS Feed
- Permalink
- Report Inappropriate Content
I have managed to populate the graph with multiple tags. I was using 'Unpivot Table'[Attributes] rather than the measure I used in the slicer for my Column Series field, however there's 2 remaining issues if anyone is able to offer insight on that.
Once more than one option is selected in the slicer, box visualisations will read (blank). Additionally once more than one Target is selected, the y-axis2 line tied to Targets disappears. I suspect this is due to it trying to sum up the values up for the Target. I believe the y-axis1 values display since they're in a stacked bar format and no summing is done.
Thank you for taking the time reading this.
- Mark as New
- Bookmark
- Subscribe
- Mute
- Subscribe to RSS Feed
- Permalink
- Report Inappropriate Content
I followed https://community.powerbi.com/t5/Desktop/Two-slicer-on-same-column/m-p/516318 and now I'm very close to what I need.
I made 2 calc tables named as instructed:


