FabCon is coming to Atlanta
Join us at FabCon Atlanta from March 16 - 20, 2026, for the ultimate Fabric, Power BI, AI and SQL community-led event. Save $200 with code FABCOMM.
Register now!- Power BI forums
- Get Help with Power BI
- Desktop
- Service
- Report Server
- Power Query
- Mobile Apps
- Developer
- DAX Commands and Tips
- Custom Visuals Development Discussion
- Health and Life Sciences
- Power BI Spanish forums
- Translated Spanish Desktop
- Training and Consulting
- Instructor Led Training
- Dashboard in a Day for Women, by Women
- Galleries
- Data Stories Gallery
- Themes Gallery
- Contests Gallery
- QuickViz Gallery
- Quick Measures Gallery
- Visual Calculations Gallery
- Notebook Gallery
- Translytical Task Flow Gallery
- TMDL Gallery
- R Script Showcase
- Webinars and Video Gallery
- Ideas
- Custom Visuals Ideas (read-only)
- Issues
- Issues
- Events
- Upcoming Events
The Power BI Data Visualization World Championships is back! Get ahead of the game and start preparing now! Learn more
- Power BI forums
- Forums
- Get Help with Power BI
- DAX Commands and Tips
- Re: How to sum one column based on another column,...
- Subscribe to RSS Feed
- Mark Topic as New
- Mark Topic as Read
- Float this Topic for Current User
- Bookmark
- Subscribe
- Printer Friendly Page
- Mark as New
- Bookmark
- Subscribe
- Mute
- Subscribe to RSS Feed
- Permalink
- Report Inappropriate Content
How to sum one column based on another column, but keep filter selection applied on table?
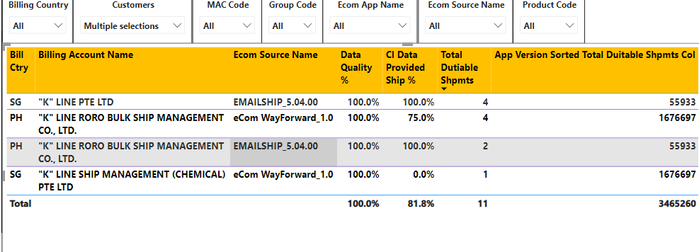
I have a table, and a set of slicers that filter the table.
Currently, I am using the "customers" slicer to filter the "billing account name" column.
I want to display the "ecom source name" with the highest number of "total duitable shpmts" in another advanced card visualisation. To do that, I need to sum up the "total duitable shpmts" column for the same "ecom source name"s. (eg. emailship should show total of 4+2=6, and ecom should show total of 4+1=5)
I have seen solutions using ALLEXCEPT, and I have tried using the following measure (shown in the last column of visualisation)
App Version Sorted Total Duitable Shpmts Col =

var VarId= 'CIN Data Quality'[Ecom Source Name]
return
CALCULATE(SUM([Total Dutiable Shpmts]), FILTER('CIN Data Quality','CIN Data Quality'[Ecom Source Name]=VarId))
But I am getting results that are disregarding the values for "billing account name" a.k.a "customers" in the filter selection.
Solved! Go to Solution.
- Mark as New
- Bookmark
- Subscribe
- Mute
- Subscribe to RSS Feed
- Permalink
- Report Inappropriate Content
@Anonymous , Try Like
CALCULATE(SUM([Total Dutiable Shpmts]), FILTER(allselected('CIN Data Quality'),'CIN Data Quality'[Ecom Source Name]=Max('CIN Data Quality'[Ecom Source Name])))
- Mark as New
- Bookmark
- Subscribe
- Mute
- Subscribe to RSS Feed
- Permalink
- Report Inappropriate Content
@Anonymous , Try Like
CALCULATE(SUM([Total Dutiable Shpmts]), FILTER(allselected('CIN Data Quality'),'CIN Data Quality'[Ecom Source Name]=Max('CIN Data Quality'[Ecom Source Name])))
- Mark as New
- Bookmark
- Subscribe
- Mute
- Subscribe to RSS Feed
- Permalink
- Report Inappropriate Content
You're an expert! Thank you so much! 👍
Helpful resources

Power BI Dataviz World Championships
The Power BI Data Visualization World Championships is back! Get ahead of the game and start preparing now!

| User | Count |
|---|---|
| 19 | |
| 13 | |
| 10 | |
| 4 | |
| 4 |
| User | Count |
|---|---|
| 31 | |
| 28 | |
| 19 | |
| 11 | |
| 10 |


