This time we’re going bigger than ever. Fabric, Power BI, SQL, AI and more. We're covering it all. You won't want to miss it.
Learn moreLevel up your Power BI skills this month - build one visual each week and tell better stories with data! Get started
Hello,
I have data that includes
| Date | Emp Id | Hrs |
| 6/20/22 | 12345 | 3 |
| 6/20/22 | 12345 | 8 |
I need to agregate the data to sum up Emp ID hours for the same day, and flag anything over 8 hrs as OT. Like so
| Date | Emp ID | Total Hrs | Reg hrs | OT |
| 6/20/22 | 12345 | 11 | 8 | 3 |
This would ideally aggregate to a higher level that does not show employee ID's and shows by locations.
Any help or resources that will help?
Solved! Go to Solution.
@OCBB_SFAFPandA , Create two measures like
Std hours =
sumx(summarize(Table, Table[Date], Table[Emp ID], "_1", Sum(Table[Hrs]) ), if([_1]> 8,8, [_1]) )
Overtime =
sumx(summarize(Table, Table[Date], Table[Emp ID], "_1", Sum(Table[Hrs]) ), if([_1]> 8, [_1]-8,0) )
Total hours = Sum(Table[Hrs])
Hey @OCBB_SFAFPandA !
I saw you already got a reply from @amitchandak using measures.
I am attaching a table and the dax code for the calculated table. Hope it helps!
Table Name = HoursWorkedTab
Date - EmpID - HoursWorked - OTHours
| Friday, June 17, 2022 | 12 | 5 | 0 |
| Friday, June 17, 2022 | 5 | 3 | 0 |
| Friday, June 17, 2022 | 12 | 0.55 | 0 |
| Friday, June 17, 2022 | 5 | 3 | 0 |
| Friday, June 17, 2022 | 8 | 9 | 1 |
| Friday, June 17, 2022 | 12 | 6 | 0 |
| Monday, June 20, 2022 | 12 | 0.25 | 0 |
| Monday, June 20, 2022 | 12 | 1 | 0 |
| Monday, June 20, 2022 | 5 | 4 | 0 |
| Monday, June 20, 2022 | 8 | 6 | 0 |
| Monday, June 20, 2022 | 8 | 1 | 0 |
| Monday, June 20, 2022 | 8 | 5 | 0 |
| Tuesday, June 21, 2022 | 8 | 7.5 | 0 |
| Tuesday, June 21, 2022 | 12 | 5 | 0 |
| Tuesday, June 21, 2022 | 5 | 7 | 0 |
| Tuesday, June 21, 2022 | 12 | 1 | 0 |
| Tuesday, June 21, 2022 | 5 | 1 | 0 |
| Tuesday, June 21, 2022 | 5 | 0.3 | 0 |
| Tuesday, June 21, 2022 | 12 | 4 | 0 |
SummarizedHours =
SUMMARIZE(
HoursWorkedTab,
HoursWorkedTab[Date],
HoursWorkedTab[EmpID],
"HoursWorked",
SUM(HoursWorkedTab[HoursWorked]),
"RegularHours",
SWITCH(TRUE,
SUM(HoursWorkedTab[HoursWorked]) <= 8, SUM(HoursWorkedTab[HoursWorked]),
SUM(HoursWorkedTab[HoursWorked]) > 8, 8),
"OTHours",
SWITCH(TRUE,
SUM(HoursWorkedTab[HoursWorked]) <= 8, 0,
SUM(HoursWorkedTab[HoursWorked]) > 8, SUM(HoursWorkedTab[HoursWorked]) - 8))
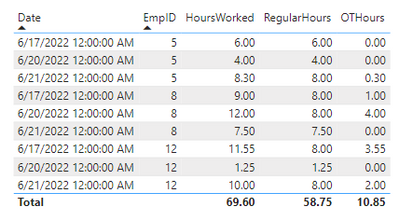
Hey @OCBB_SFAFPandA !
I saw you already got a reply from @amitchandak using measures.
I am attaching a table and the dax code for the calculated table. Hope it helps!
Table Name = HoursWorkedTab
Date - EmpID - HoursWorked - OTHours
| Friday, June 17, 2022 | 12 | 5 | 0 |
| Friday, June 17, 2022 | 5 | 3 | 0 |
| Friday, June 17, 2022 | 12 | 0.55 | 0 |
| Friday, June 17, 2022 | 5 | 3 | 0 |
| Friday, June 17, 2022 | 8 | 9 | 1 |
| Friday, June 17, 2022 | 12 | 6 | 0 |
| Monday, June 20, 2022 | 12 | 0.25 | 0 |
| Monday, June 20, 2022 | 12 | 1 | 0 |
| Monday, June 20, 2022 | 5 | 4 | 0 |
| Monday, June 20, 2022 | 8 | 6 | 0 |
| Monday, June 20, 2022 | 8 | 1 | 0 |
| Monday, June 20, 2022 | 8 | 5 | 0 |
| Tuesday, June 21, 2022 | 8 | 7.5 | 0 |
| Tuesday, June 21, 2022 | 12 | 5 | 0 |
| Tuesday, June 21, 2022 | 5 | 7 | 0 |
| Tuesday, June 21, 2022 | 12 | 1 | 0 |
| Tuesday, June 21, 2022 | 5 | 1 | 0 |
| Tuesday, June 21, 2022 | 5 | 0.3 | 0 |
| Tuesday, June 21, 2022 | 12 | 4 | 0 |
SummarizedHours =
SUMMARIZE(
HoursWorkedTab,
HoursWorkedTab[Date],
HoursWorkedTab[EmpID],
"HoursWorked",
SUM(HoursWorkedTab[HoursWorked]),
"RegularHours",
SWITCH(TRUE,
SUM(HoursWorkedTab[HoursWorked]) <= 8, SUM(HoursWorkedTab[HoursWorked]),
SUM(HoursWorkedTab[HoursWorked]) > 8, 8),
"OTHours",
SWITCH(TRUE,
SUM(HoursWorkedTab[HoursWorked]) <= 8, 0,
SUM(HoursWorkedTab[HoursWorked]) > 8, SUM(HoursWorkedTab[HoursWorked]) - 8))
@OCBB_SFAFPandA , Create two measures like
Std hours =
sumx(summarize(Table, Table[Date], Table[Emp ID], "_1", Sum(Table[Hrs]) ), if([_1]> 8,8, [_1]) )
Overtime =
sumx(summarize(Table, Table[Date], Table[Emp ID], "_1", Sum(Table[Hrs]) ), if([_1]> 8, [_1]-8,0) )
Total hours = Sum(Table[Hrs])
Thanks @amitchandak !
This worked perfectly! the _1 is the var name you gave the summary total?
if I need a formula to mark any hours worked over 40 hours as OT for the week, how would I do that without dbl counting hours for OT?
You've helped me im previous threads and you are very knowledgeable. I followed your channel and will learn from your videos.
Check out the April 2026 Power BI update to learn about new features.
Sign up to receive a private message when registration opens and key events begin.
If you have recently started exploring Fabric, we'd love to hear how it's going. Your feedback can help with product improvements.
| User | Count |
|---|---|
| 5 | |
| 4 | |
| 3 | |
| 2 | |
| 2 |
| User | Count |
|---|---|
| 7 | |
| 6 | |
| 6 | |
| 5 | |
| 4 |