Fabric Data Days starts November 4th!
Advance your Data & AI career with 50 days of live learning, dataviz contests, hands-on challenges, study groups & certifications and more!
Get registered- Power BI forums
- Get Help with Power BI
- Desktop
- Service
- Report Server
- Power Query
- Mobile Apps
- Developer
- DAX Commands and Tips
- Custom Visuals Development Discussion
- Health and Life Sciences
- Power BI Spanish forums
- Translated Spanish Desktop
- Training and Consulting
- Instructor Led Training
- Dashboard in a Day for Women, by Women
- Galleries
- Data Stories Gallery
- Themes Gallery
- Contests Gallery
- Quick Measures Gallery
- Visual Calculations Gallery
- Notebook Gallery
- Translytical Task Flow Gallery
- TMDL Gallery
- R Script Showcase
- Webinars and Video Gallery
- Ideas
- Custom Visuals Ideas (read-only)
- Issues
- Issues
- Events
- Upcoming Events
Get Fabric Certified for FREE during Fabric Data Days. Don't miss your chance! Learn more
- Power BI forums
- Forums
- Get Help with Power BI
- DAX Commands and Tips
- Re: Getting Previous Row using DAX measure
- Subscribe to RSS Feed
- Mark Topic as New
- Mark Topic as Read
- Float this Topic for Current User
- Bookmark
- Subscribe
- Printer Friendly Page
- Mark as New
- Bookmark
- Subscribe
- Mute
- Subscribe to RSS Feed
- Permalink
- Report Inappropriate Content
Getting Previous Row using DAX measure
Hello all,
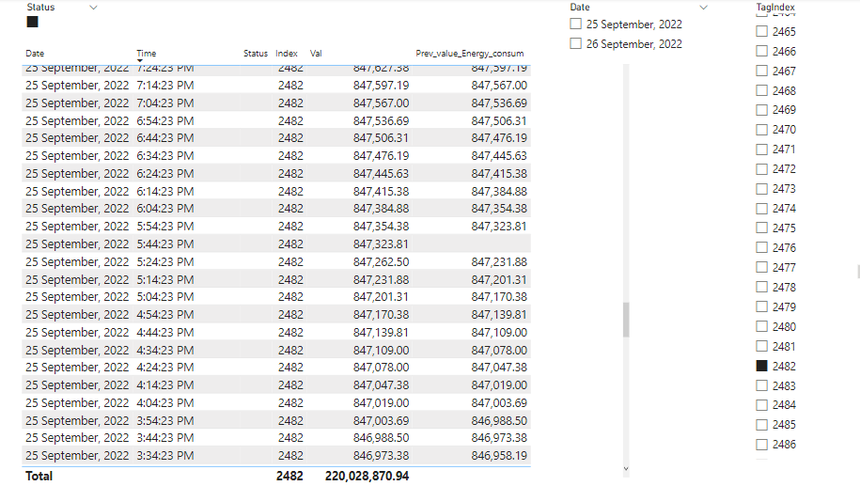
I need to get previous record based on DateTime column and grouped by TagIndex column
I created this measure,
Can anyone help me?
Thanks and Regards
Mihir
Solved! Go to Solution.
- Mark as New
- Bookmark
- Subscribe
- Mute
- Subscribe to RSS Feed
- Permalink
- Report Inappropriate Content
Hi,
Thank you for your sharing.
Could you please try the below if it works?
Prev_value_Energy_consum =
VAR Index = [Index]
VAR Prev_datetime =
    MAXX (
        FILTER (
            ALLSELECTED ( FloatTable ),
            FloatTable[Date] = SELECTEDVALUE ( FloatTable[Date] )
                && FloatTable[Time] < SELECTEDVALUE ( FloatTable[Time] )
        ),
        FloatTable[Time]
    )
VAR Prev_date =
    MAXX (
        FILTER (
            ALLSELECTED ( FloatTable ),
            FloatTable[Date] < SELECTEDVALUE ( FloatTable[Date] )
        ),
        FloatTable[Date]
    )
VAR Prev_time =
    MAXX (
        FILTER ( ALLSELECTED ( FloatTable ), FloatTable[Date] = Prev_date ),
        FloatTable[Time]
    )
RETURN
    SWITCH (
        TRUE (),
        NOT ISBLANK ( Prev_datetime ),
            CALCULATE (
                SUMX ( FloatTable, VAR Index = FloatTable[TagIndex] RETURN FloatTable[Val] ),
                FILTER (
                    ALLSELECTED ( FloatTable ),
                    FloatTable[Time] = Prev_datetime
                        && FloatTable[Date] = SELECTEDVALUE ( FloatTable[Date] )
                        && FloatTable[TagIndex] = Index
                )
            ),
        CALCULATE (
            SUMX ( FloatTable, VAR Index = FloatTable[TagIndex] RETURN FloatTable[Val] ),
            FILTER (
                ALLSELECTED ( FloatTable ),
                FloatTable[Time] = Prev_time
                    && FloatTable[Date] = Prev_date
                    && FloatTable[TagIndex] = Index
            )
        )
    )
If this post helps, then please consider accepting it as the solution to help other members find it faster, and give a big thumbs up.
Click here to visit my LinkedIn page
Click here to schedule a short Teams meeting to discuss your question.
- Mark as New
- Bookmark
- Subscribe
- Mute
- Subscribe to RSS Feed
- Permalink
- Report Inappropriate Content
Hi,
I am not sure if I understood your question correctly, but please try the below measure whether it suits your requirement.
Prev_value_Energy_consum =
VAR Prev_date =
    MAXX (
        FILTER (
            ALLSELECTED ( FloatTable[Time] ),
            FloatTable[Time] < SELECTEDVALUE ( FloatTable[Time] )
        ),
        FloatTable[Time]
    )
RETURN
    CALCULATE (
        SUMX ( FloatTable, FloatTable[Val] ),
        FILTER ( ALLSELECTED ( FloatTable ), FloatTable[Time] = Prev_date )
    )
If this post helps, then please consider accepting it as the solution to help other members find it faster, and give a big thumbs up.
Click here to visit my LinkedIn page
Click here to schedule a short Teams meeting to discuss your question.
- Mark as New
- Bookmark
- Subscribe
- Mute
- Subscribe to RSS Feed
- Permalink
- Report Inappropriate Content
Hi @Jihwan_Kim
Actually we have a column called 'TagIndex' which have values from 0 to 8000 and each Tag index refers to a pump located at different regions. So basically these are different pumps.
And There is a column called 'Val' which has cumulative value coming from database, we need to subtract current row from previous row to convert it to non cumulative value.
So that should be the main purpose of the logic, so I am creating a measure to get Prev_row for that record based on different tagindexes I select. after that I will create a calculated column which will subtract value from this measure.
I tried your formula but it is still showing those blank values at some point of time as I showed in screenshot.
Thanks and Regards
Mihir
- Mark as New
- Bookmark
- Subscribe
- Mute
- Subscribe to RSS Feed
- Permalink
- Report Inappropriate Content
Hi,
Thank you for your feedback.
Could you please share your sample pbix file's link (onedrive, googledrive, dropbox, any other) here, and then I can try to look into it to come up with a more accurate solution.
Thank you.
If this post helps, then please consider accepting it as the solution to help other members find it faster, and give a big thumbs up.
Click here to visit my LinkedIn page
Click here to schedule a short Teams meeting to discuss your question.
- Mark as New
- Bookmark
- Subscribe
- Mute
- Subscribe to RSS Feed
- Permalink
- Report Inappropriate Content
Hey @Jihwan_Kim
Here is the link for the sample data : https://drive.google.com/drive/folders/1651tuMrez13NX48mrdh_UVSZuk7diGMP?usp=sharing
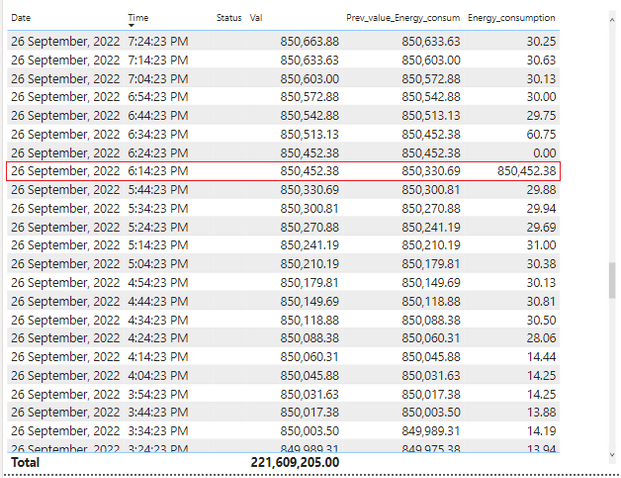
In the table visual if you see 'Prev_row_energy_consum' field, there will be some blank rows in the table at some point of time... I don't how to fix this...but I've noticed some pattern in the blank rows, let me try to explain.
Actually in Time column we can see there is a difference of 10 minutes between any two consecutive rows....but at some point of time when this difference is more than 10 minutes then it is showing blank rows.... I have confirmed this by going to different dates and different tag indexes. Can you please help me fixing this?
Thanks and Regards
Mihir
- Mark as New
- Bookmark
- Subscribe
- Mute
- Subscribe to RSS Feed
- Permalink
- Report Inappropriate Content
Hi,
Thank you for your sharing.
Could you please try the below if it works?
Prev_value_Energy_consum =
VAR Index = [Index]
VAR Prev_datetime =
    MAXX (
        FILTER (
            ALLSELECTED ( FloatTable ),
            FloatTable[Date] = SELECTEDVALUE ( FloatTable[Date] )
                && FloatTable[Time] < SELECTEDVALUE ( FloatTable[Time] )
        ),
        FloatTable[Time]
    )
VAR Prev_date =
    MAXX (
        FILTER (
            ALLSELECTED ( FloatTable ),
            FloatTable[Date] < SELECTEDVALUE ( FloatTable[Date] )
        ),
        FloatTable[Date]
    )
VAR Prev_time =
    MAXX (
        FILTER ( ALLSELECTED ( FloatTable ), FloatTable[Date] = Prev_date ),
        FloatTable[Time]
    )
RETURN
    SWITCH (
        TRUE (),
        NOT ISBLANK ( Prev_datetime ),
            CALCULATE (
                SUMX ( FloatTable, VAR Index = FloatTable[TagIndex] RETURN FloatTable[Val] ),
                FILTER (
                    ALLSELECTED ( FloatTable ),
                    FloatTable[Time] = Prev_datetime
                        && FloatTable[Date] = SELECTEDVALUE ( FloatTable[Date] )
                        && FloatTable[TagIndex] = Index
                )
            ),
        CALCULATE (
            SUMX ( FloatTable, VAR Index = FloatTable[TagIndex] RETURN FloatTable[Val] ),
            FILTER (
                ALLSELECTED ( FloatTable ),
                FloatTable[Time] = Prev_time
                    && FloatTable[Date] = Prev_date
                    && FloatTable[TagIndex] = Index
            )
        )
    )
If this post helps, then please consider accepting it as the solution to help other members find it faster, and give a big thumbs up.
Click here to visit my LinkedIn page
Click here to schedule a short Teams meeting to discuss your question.
- Mark as New
- Bookmark
- Subscribe
- Mute
- Subscribe to RSS Feed
- Permalink
- Report Inappropriate Content
Hi @Jihwan_Kim
Thankyou so much measure is working correct,
but there is still one small issue remaining when I am trying to subtract the value from previous value using calculated column, then It is working fine but at same point of time when time difference b/w 2 consecutive rows is greater than 10 minutes it is showing same value rather than subtracting.
I think this could beacuse we've used switch function in the measure and calculted column is confused which value to take, I may not correct I am just thinking out loud.
Here is the sample file for the same : https://drive.google.com/drive/folders/1651tuMrez13NX48mrdh_UVSZuk7diGMP?usp=sharing
Thanks and Regards
Mihir
- Mark as New
- Bookmark
- Subscribe
- Mute
- Subscribe to RSS Feed
- Permalink
- Report Inappropriate Content
Hi,
Could you please try writing a measure like below, instead of creating Calcualted Column?
Test measure: =
SUM(FloatTable[Val]) - [Prev_value_Energy_consum]
If this post helps, then please consider accepting it as the solution to help other members find it faster, and give a big thumbs up.
Click here to visit my LinkedIn page
Click here to schedule a short Teams meeting to discuss your question.
- Mark as New
- Bookmark
- Subscribe
- Mute
- Subscribe to RSS Feed
- Permalink
- Report Inappropriate Content
Hi @Jihwan_Kim
Yeah It is working in measure, but I am prefering calculated column beacuse I need Sum of this and in measure it is giving incorrect value, or I am not sure to fix it in measure..
Can you help me with calculated column or measure which would aggregate same value as in calculated column?
Thanks and Regards
Mihir
- Mark as New
- Bookmark
- Subscribe
- Mute
- Subscribe to RSS Feed
- Permalink
- Report Inappropriate Content
Hi,
Please check the below DAX formula for creating a calcualted column.
It will take quite a long time to load the newly created column, but I could not optimize it for now. (On my computer, it took more than 3 mintues to load a calcualted column).
My suggestion is still creating a measure to show the same result.
Thanks.
Energy_consum CC =
VAR _configtable =
    FILTER ( FloatTable, FloatTable[TagIndex] = EARLIER ( FloatTable[TagIndex] ) )
VAR Prev_datetime =
    MAXX (
        FILTER (
            _configtable,
            FloatTable[Date] = EARLIER ( FloatTable[Date] )
                && FloatTable[Time] < EARLIER ( FloatTable[Time] )
        ),
        FloatTable[Time]
    )
VAR Prev_date =
    MAXX (
        FILTER ( _configtable, FloatTable[Date] < EARLIER ( FloatTable[Date] ) ),
        FloatTable[Date]
    )
VAR Prev_time =
    MAXX ( FILTER ( _configtable, FloatTable[Date] = Prev_date ), FloatTable[Time] )
RETURN
    FloatTable[Val]
        - SWITCH (
            TRUE (),
            NOT ISBLANK ( Prev_datetime ),
                MAXX (
                    FILTER (
                        _configtable,
                        FloatTable[Time] = Prev_datetime
                            && FloatTable[Date] = EARLIER ( FloatTable[Date] )
                    ),
                    FloatTable[Val]
                ),
            MAXX (
                FILTER (
                    _configtable,
                    FloatTable[Time] = Prev_time
                        && FloatTable[Date] = Prev_date
                ),
                FloatTable[Val]
            )
        )
If this post helps, then please consider accepting it as the solution to help other members find it faster, and give a big thumbs up.
Click here to visit my LinkedIn page
Click here to schedule a short Teams meeting to discuss your question.
- Mark as New
- Bookmark
- Subscribe
- Mute
- Subscribe to RSS Feed
- Permalink
- Report Inappropriate Content
Hi @Jihwan_Kim ,
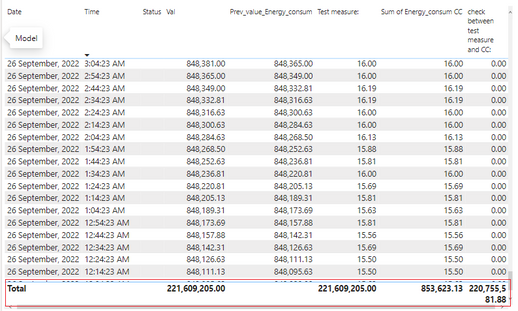
Actually I also want to use measure only for this, but as you can see in the grand total, value is incorrect for the measure( it is same as the Val column but it shouldn't be), that is the main reason I am looking for any other approach
Thanks and Regards
Mihir
- Mark as New
- Bookmark
- Subscribe
- Mute
- Subscribe to RSS Feed
- Permalink
- Report Inappropriate Content
Hi @Jihwan_Kim
I used your formula for calculated column in my original file which has millions of rows, there I am not able to execute the calculated column, It is showing 'Not Enough Memory Error'.
I think this is because it is very complex formula with so many variables, we can try using the measure we created for previous value in the calculated column to optimize the formula...
But I am not able to put this all in a formula which shows correct value.
Thanks and Regards
Mihir
- Mark as New
- Bookmark
- Subscribe
- Mute
- Subscribe to RSS Feed
- Permalink
- Report Inappropriate Content
Hi,
Thank you for your feedback.
Could you please try the below? and please check the attached pbix file.
- Delete Calculated column that I created.
- Create three measures like below.
- Please check if the numbers are correct.
- If the numbers are correct, no need to create a Calcualted column.
Val Sum: =
SUM( FloatTable[Val] )
Prev_value_Energy_consum =
var _currentdate = MAX( FloatTable[Date])
var _currenttime = MAX(FloatTable[Time])
VAR Prev_datetime =
MAXX (
FILTER (
ALLSELECTED ( FloatTable ),
FloatTable[Date] = _currentdate
&& FloatTable[Time] < _currenttime
),
FloatTable[Time]
)
VAR Prev_date =
MAXX (
FILTER (
ALLSELECTED ( FloatTable ),
FloatTable[Date] < _currentdate
),
FloatTable[Date]
)
VAR Prev_time =
MAXX (
FILTER ( ALLSELECTED ( FloatTable ), FloatTable[Date] = Prev_date ),
FloatTable[Time]
)
RETURN
SWITCH (
TRUE (),
NOT ISBLANK ( Prev_datetime ),
CALCULATE (
SUMX ( FloatTable, FloatTable[Val] ),
FILTER (
ALLSELECTED ( FloatTable ),
FloatTable[Time] = Prev_datetime
&& FloatTable[Date] = _currentdate
)
),
CALCULATE (
SUMX ( FloatTable, FloatTable[Val] ),
FILTER (
ALLSELECTED ( FloatTable ),
FloatTable[Time] = Prev_time
&& FloatTable[Date] = Prev_date
)
)
)Test measure: =
IF (
HASONEVALUE ( FloatTable[Time] ),
[Val Sum:] - [Prev_value_Energy_consum],
SUMX ( FloatTable, [Val Sum:] - [Prev_value_Energy_consum] )
)
If this post helps, then please consider accepting it as the solution to help other members find it faster, and give a big thumbs up.
Click here to visit my LinkedIn page
Click here to schedule a short Teams meeting to discuss your question.
- Mark as New
- Bookmark
- Subscribe
- Mute
- Subscribe to RSS Feed
- Permalink
- Report Inappropriate Content
Hi @Jihwan_Kim
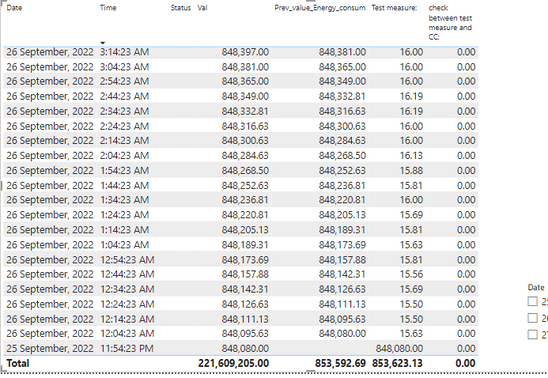
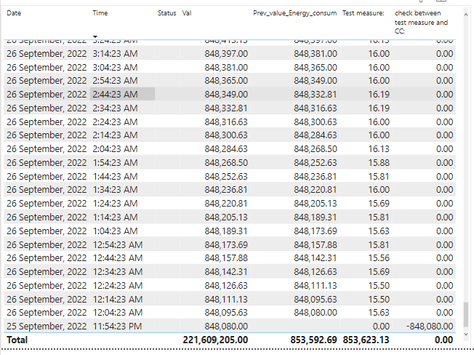
Thankyou for this measure but if you see at the last row of the table visual it is showing some value, but I need it to be 0 rather than some value because from that time pump is started to value would be zero.
So I modified the formula using IF condition, to do that, but there is a issue in grand total it is still showing the same value as it was showing before rather than summing the value of records in this column.
I have used this measure:
Thanks and Regards
Mihir
- Mark as New
- Bookmark
- Subscribe
- Mute
- Subscribe to RSS Feed
- Permalink
- Report Inappropriate Content
Hi,
Thank you for your feedback.
Perhaps, I do not fully understand about what the data is saying.
On grand total row, do you want to show zero? Or, blank?
If it is zero, may I ask why is it zero?
If this post helps, then please consider accepting it as the solution to help other members find it faster, and give a big thumbs up.
Click here to visit my LinkedIn page
Click here to schedule a short Teams meeting to discuss your question.
- Mark as New
- Bookmark
- Subscribe
- Mute
- Subscribe to RSS Feed
- Permalink
- Report Inappropriate Content
Hi @Jihwan_Kim
Sorry I think I was not able to explain you clearly.
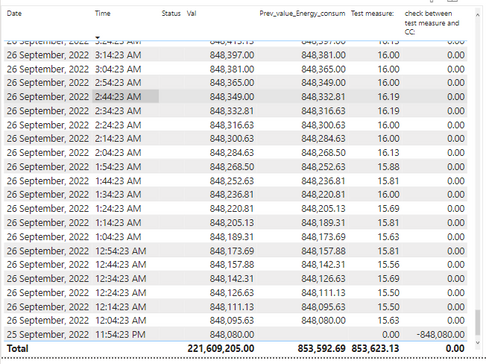
I was saying I want to see 0 on the last record of the table not on the grand total, and I have done that by modifying the measure. You can see the screenshot
But now issue is, in the grand total of Test Measure it is not summing the values of that column it is showing some different value.
I am confused in this issue and I would be really greatful if it is resolved 🙂
Thanks and Regards
Mihir
- Mark as New
- Bookmark
- Subscribe
- Mute
- Subscribe to RSS Feed
- Permalink
- Report Inappropriate Content
Hi,
May I ask what is the number that you want to see on Grand total?
If this post helps, then please consider accepting it as the solution to help other members find it faster, and give a big thumbs up.
Click here to visit my LinkedIn page
Click here to schedule a short Teams meeting to discuss your question.
- Mark as New
- Bookmark
- Subscribe
- Mute
- Subscribe to RSS Feed
- Permalink
- Report Inappropriate Content
Hi @Jihwan_Kim
I don't know the actual value, but I need the sum of all the values in Test Measure.
Thanks and Regards
Mihir
- Mark as New
- Bookmark
- Subscribe
- Mute
- Subscribe to RSS Feed
- Permalink
- Report Inappropriate Content
Hi,
Could you please check the attached file?
I tried to create measures again, and please check the last measure = [test measure total fix] if it shows a correct number for the Grand Total row.
Please be noted that the DAX formula might be slow. I will try to find a way to optimize the DAX formula, but please check whether the number on the grand total level for Test Measure Total Fix is correct.
Thanks.
If this post helps, then please consider accepting it as the solution to help other members find it faster, and give a big thumbs up.
Click here to visit my LinkedIn page
Click here to schedule a short Teams meeting to discuss your question.
- Mark as New
- Bookmark
- Subscribe
- Mute
- Subscribe to RSS Feed
- Permalink
- Report Inappropriate Content
Hi @Jihwan_Kim
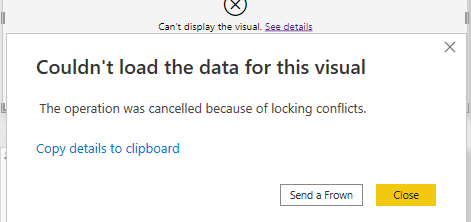
Thanks for the Measure it is showing correct value... but yeah it is working slow, and in my original data there are millions of rows and there it is taking so much time to execute on the visual and after that showing error :
Can we optimize this measure or we should for look for another approach ?
Thanks and Regards
Mihir
- Mark as New
- Bookmark
- Subscribe
- Mute
- Subscribe to RSS Feed
- Permalink
- Report Inappropriate Content
Hi,
Please check the attached pbix file.
All measures are in the attached pbix file. It is still slow, but I it is faster than before.
Could you please check if it works for your datamodel?
If this post helps, then please consider accepting it as the solution to help other members find it faster, and give a big thumbs up.
Click here to visit my LinkedIn page
Click here to schedule a short Teams meeting to discuss your question.
Helpful resources

Fabric Data Days
Advance your Data & AI career with 50 days of live learning, contests, hands-on challenges, study groups & certifications and more!

Power BI Monthly Update - October 2025
Check out the October 2025 Power BI update to learn about new features.

| User | Count |
|---|---|
| 9 | |
| 5 | |
| 4 | |
| 3 | |
| 3 |
| User | Count |
|---|---|
| 13 | |
| 9 | |
| 9 | |
| 9 | |
| 8 |
