Join us at FabCon Vienna from September 15-18, 2025
The ultimate Fabric, Power BI, SQL, and AI community-led learning event. Save €200 with code FABCOMM.
Get registered- Power BI forums
- Get Help with Power BI
- Desktop
- Service
- Report Server
- Power Query
- Mobile Apps
- Developer
- DAX Commands and Tips
- Custom Visuals Development Discussion
- Health and Life Sciences
- Power BI Spanish forums
- Translated Spanish Desktop
- Training and Consulting
- Instructor Led Training
- Dashboard in a Day for Women, by Women
- Galleries
- Data Stories Gallery
- Themes Gallery
- Contests Gallery
- Quick Measures Gallery
- Notebook Gallery
- Translytical Task Flow Gallery
- TMDL Gallery
- R Script Showcase
- Webinars and Video Gallery
- Ideas
- Custom Visuals Ideas (read-only)
- Issues
- Issues
- Events
- Upcoming Events
Enhance your career with this limited time 50% discount on Fabric and Power BI exams. Ends September 15. Request your voucher.
- Power BI forums
- Forums
- Get Help with Power BI
- DAX Commands and Tips
- Re: Filter Dax rows with list
- Subscribe to RSS Feed
- Mark Topic as New
- Mark Topic as Read
- Float this Topic for Current User
- Bookmark
- Subscribe
- Printer Friendly Page
- Mark as New
- Bookmark
- Subscribe
- Mute
- Subscribe to RSS Feed
- Permalink
- Report Inappropriate Content
Filter Dax rows with list
how to filter rows from a table type
1
2
3
4
using a list column type
1,2,3,4
in another table using dax functions?
ex: select value 1,3 in list and show
1
3
in table rows
The tables do not have any data relationship and all data is text type.
Solved! Go to Solution.
- Mark as New
- Bookmark
- Subscribe
- Mute
- Subscribe to RSS Feed
- Permalink
- Report Inappropriate Content
@Felipepbiplis As you mentioned there is no relation between table , A Nice way to solve this these using relationships with bridge table introduced between them and use that to get best out of the Power BI Modelling
However Alternately you can create measure to pass one selected value from one visual to other and use that to apply filters on the other in Filters pane or play bit with visual interactions
Here is DAX which can help you
1. Selected Value = SELECTEDVALUE(TAble1[Profiles],"No filter")
2. If filtered =
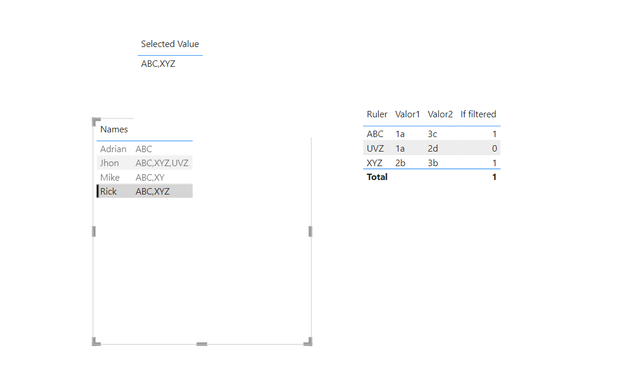
Result will be something like below , Note that if i choose rick the IFfiltered measure becomes 1 for only those Rows in Table 2 , The you can use If filtered = 1 in your filter pane visual if you like
But I believe changing your model can you give much better and clean results !

-------------------------------------------------------------------------------------------------------------------------------
Good day, amigo! Have I provided the solution? If so, please let me know by adding the lovely, sweet "solution" tag to my post. And hey, if you're feeling very kind, give me a Kudos; after all, who doesn't enjoy a little digital gratitude?
- Mark as New
- Bookmark
- Subscribe
- Mute
- Subscribe to RSS Feed
- Permalink
- Report Inappropriate Content
@Felipepbiplis As you mentioned there is no relation between table , A Nice way to solve this these using relationships with bridge table introduced between them and use that to get best out of the Power BI Modelling
However Alternately you can create measure to pass one selected value from one visual to other and use that to apply filters on the other in Filters pane or play bit with visual interactions
Here is DAX which can help you
1. Selected Value = SELECTEDVALUE(TAble1[Profiles],"No filter")
2. If filtered =
Result will be something like below , Note that if i choose rick the IFfiltered measure becomes 1 for only those Rows in Table 2 , The you can use If filtered = 1 in your filter pane visual if you like
But I believe changing your model can you give much better and clean results !

-------------------------------------------------------------------------------------------------------------------------------
Good day, amigo! Have I provided the solution? If so, please let me know by adding the lovely, sweet "solution" tag to my post. And hey, if you're feeling very kind, give me a Kudos; after all, who doesn't enjoy a little digital gratitude?
- Mark as New
- Bookmark
- Subscribe
- Mute
- Subscribe to RSS Feed
- Permalink
- Report Inappropriate Content
@Felipepbiplis I tried to understand what you posted , Correct me if i am wrong
I am assuming you already expanded your original list in to rows
if not then do expand it in Power Query as below
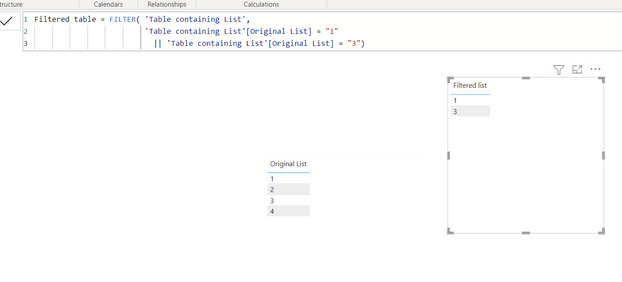
Then use the simple Filter using DAX to create a new Table
Also replace "Table containing list" with the name of your original table , and replace column "Original List" with the name of that column.
Hope it Helps
- Mark as New
- Bookmark
- Subscribe
- Mute
- Subscribe to RSS Feed
- Permalink
- Report Inappropriate Content
Okay, I'll try to explain better.
There are two datatables in the power bi and
the tables have no relationship and all data is text type, tables below:
table1
| Names | Profiles |
| Adrian | ABC |
| Rick | ABC,XYZ |
| Jhon | ABC,XYZ,UVZ |
| Mike | ABC,XYZ |
table2
| Ruler | Valor1 | Valor2 |
| ABC | 1a | 3c |
| XYZ | 2b | 3b |
| UVZ | 1a | 2d |
I'm going to place the two tables in a common table visual on the dashboard.
When I click on a name in the table 1 visual, I want table2 to filter and show the filtered profiles rule corresponding to the name that was clicked.
example:
If I click on Rick in table1
table2 will look like this
| Ruler | Valor1 | Valor2 |
| ABC | 1a | 3c |
| XYZ | 2b | 3b |
thanks!
Helpful resources
| User | Count |
|---|---|
| 14 | |
| 11 | |
| 6 | |
| 6 | |
| 5 |
| User | Count |
|---|---|
| 28 | |
| 17 | |
| 12 | |
| 7 | |
| 5 |


