Join us at FabCon Vienna from September 15-18, 2025
The ultimate Fabric, Power BI, SQL, and AI community-led learning event. Save €200 with code FABCOMM.
Get registered- Power BI forums
- Get Help with Power BI
- Desktop
- Service
- Report Server
- Power Query
- Mobile Apps
- Developer
- DAX Commands and Tips
- Custom Visuals Development Discussion
- Health and Life Sciences
- Power BI Spanish forums
- Translated Spanish Desktop
- Training and Consulting
- Instructor Led Training
- Dashboard in a Day for Women, by Women
- Galleries
- Data Stories Gallery
- Themes Gallery
- Contests Gallery
- Quick Measures Gallery
- Notebook Gallery
- Translytical Task Flow Gallery
- TMDL Gallery
- R Script Showcase
- Webinars and Video Gallery
- Ideas
- Custom Visuals Ideas (read-only)
- Issues
- Issues
- Events
- Upcoming Events
Enhance your career with this limited time 50% discount on Fabric and Power BI exams. Ends September 15. Request your voucher.
- Power BI forums
- Forums
- Get Help with Power BI
- DAX Commands and Tips
- Re: Fill blank values with previous value in the s...
- Subscribe to RSS Feed
- Mark Topic as New
- Mark Topic as Read
- Float this Topic for Current User
- Bookmark
- Subscribe
- Printer Friendly Page
- Mark as New
- Bookmark
- Subscribe
- Mute
- Subscribe to RSS Feed
- Permalink
- Report Inappropriate Content
Fill blank values with previous value in the same column (linear increas)
Hi all,
I am quite desperate with this problem so i would like to know if you could help me.
I have this table (Table1) :
| Date | Value |
01/2012 | 0,78330993 |
| 01/2013 | 0,80190761 |
| 01/2014 | 0,82355707 |
| 01/2015 | |
| 01/2016 | |
| 01/2017 |
and i need to fill blank rows with the previous year value multiplied by (1+0.02). For example, for row 01/2015 it should be Value in 01/2014*(1+0.02). A linear increase applied only for the blank rows.
The result should be:
| Fecha | Total Year |
| domingo, 1 de enero de 2012 | 0,78330993 |
| martes, 1 de enero de 2013 | 0,80190761 |
| miércoles, 1 de enero de 2014 | 0,82355707 |
| jueves, 1 de enero de 2015 | 0,84002821 |
| viernes, 1 de enero de 2016 | 0,85682877 |
| domingo, 1 de enero de 2017 | 0,87396535 |
All help will be appreciate.
Thank you in advance,
Andrea.
Solved! Go to Solution.
- Mark as New
- Bookmark
- Subscribe
- Mute
- Subscribe to RSS Feed
- Permalink
- Report Inappropriate Content
Hi @Anonymous ,
These type of questions are the most fun because it allows me to really be creative 😄 Anyway, here is a solution for you.
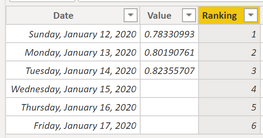
First I have created a ranking column based on date. The reason is that I don't know if your real dataset has patches of empty values or only a few empty rows at the end of the dataset. Either way, I need to fill it up based on the last known value with a growth factor of 1.02. Thus, a ranking will come in handy later:
Ranking = RANKX(Table1, Table1[Date], , ASC, Dense)Next, I created a calculated column with the following DAX:
Filled = IF(Table1[Value] = BLANK(),
    VAR _curRank = Table1[Ranking]
    VAR _lastNonBlankRank = MAXX(FILTER(table1, Table1[Ranking] < _curRank && Table1[Value] <> BLANK()), Table1[Ranking])
    VAR _lastNonBlankValue = LOOKUPVALUE('Table1'[Value], Table1[Ranking], _lastNonBlankRank)
    RETURN
    _lastNonBlankValue * POWER(1.02, _curRank - _lastNonBlankRank),
    Table1[Value])
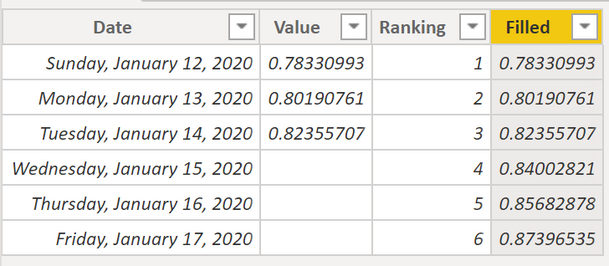
Basically it returns the value in the [Value] column if there is one, but if there isn't we are going to do something special. First we store some variables, like current row ranking number, last ranking number that has a non-blank value in the [Value] column and the actual last non-blank value of the [Value] column. Then we return the last non-blank value * 1.02 ^ (thisrow ranking - last non blank ranking). This returns the following: (I changed the data layout to a maximum of 8 decimals so this would be easily compared to your example)
Let me know if this is clear and meets your requirements 🙂
Kind regards
Djerro123
-------------------------------
If this answered your question, please mark it as the Solution. This also helps others to find what they are looking for.
Keep those thumbs up coming! 🙂
Did I answer your question? Mark my post as a solution!
Proud to be a Super User!
- Mark as New
- Bookmark
- Subscribe
- Mute
- Subscribe to RSS Feed
- Permalink
- Report Inappropriate Content
Hi @Anonymous
Yes we absolutely can! I created this measure (it will only work in a table visual with all the rows of the original table):
FilledAsMeasure =
IF(SELECTEDVALUE(Table1[Value]) = BLANK(),
    VAR _curRank = SELECTEDVALUE(Table1[Ranking])
    VAR _lastNonBlankRank = MAXX(FILTER(ALL(table1), Table1[Ranking] < _curRank && Table1[Value] <> BLANK()), Table1[Ranking])
    VAR _lastNonBlankValue = LOOKUPVALUE('Table1'[Value], Table1[Ranking], _lastNonBlankRank)
    RETURN
    _lastNonBlankValue * POWER(1+Growth[Growth Value], _curRank - _lastNonBlankRank),
    SELECTEDVALUE(Table1[Value]))
I created a parameter called Growth with min=0, max = 0.2 and step =0.01.
You can find my PBIX here (Table1 and page AndresSantest, ignore other tables please).: https://1drv.ms/u/s!Ancq8HFZYL_aiJByiLcdu4Aniq5kvA?e=MD7x8J
Let me know if this solves your issue and please mark it as the solution if it does 🙂
Kind regards
Djerro123
-------------------------------
If this answered your question, please mark it as the Solution. This also helps others to find what they are looking for.
Keep those thumbs up coming! 🙂
Did I answer your question? Mark my post as a solution!
Proud to be a Super User!
- Mark as New
- Bookmark
- Subscribe
- Mute
- Subscribe to RSS Feed
- Permalink
- Report Inappropriate Content
Thank you so much @JarroVGIT ! It works perfect!!
However, now my client ask me to have this 0.02 "variable". I mean, they want me to have a "what if" paramter that switch from 0.02 to 0.1 with a slicer that modify the calculation of the column. It is possible to have it like that? I know that columns are not "dynamic" and they can not be modifed by a parameter but maybe if i change the column to a mesure... it's possible? How can i do it?
Thank you again 🙂
- Mark as New
- Bookmark
- Subscribe
- Mute
- Subscribe to RSS Feed
- Permalink
- Report Inappropriate Content
Hi @Anonymous
Yes we absolutely can! I created this measure (it will only work in a table visual with all the rows of the original table):
FilledAsMeasure =
IF(SELECTEDVALUE(Table1[Value]) = BLANK(),
    VAR _curRank = SELECTEDVALUE(Table1[Ranking])
    VAR _lastNonBlankRank = MAXX(FILTER(ALL(table1), Table1[Ranking] < _curRank && Table1[Value] <> BLANK()), Table1[Ranking])
    VAR _lastNonBlankValue = LOOKUPVALUE('Table1'[Value], Table1[Ranking], _lastNonBlankRank)
    RETURN
    _lastNonBlankValue * POWER(1+Growth[Growth Value], _curRank - _lastNonBlankRank),
    SELECTEDVALUE(Table1[Value]))
I created a parameter called Growth with min=0, max = 0.2 and step =0.01.
You can find my PBIX here (Table1 and page AndresSantest, ignore other tables please).: https://1drv.ms/u/s!Ancq8HFZYL_aiJByiLcdu4Aniq5kvA?e=MD7x8J
Let me know if this solves your issue and please mark it as the solution if it does 🙂
Kind regards
Djerro123
-------------------------------
If this answered your question, please mark it as the Solution. This also helps others to find what they are looking for.
Keep those thumbs up coming! 🙂
Did I answer your question? Mark my post as a solution!
Proud to be a Super User!
- Mark as New
- Bookmark
- Subscribe
- Mute
- Subscribe to RSS Feed
- Permalink
- Report Inappropriate Content
Thank you!! It works perfect!! 😍
- Mark as New
- Bookmark
- Subscribe
- Mute
- Subscribe to RSS Feed
- Permalink
- Report Inappropriate Content
Hi @Anonymous ,
These type of questions are the most fun because it allows me to really be creative 😄 Anyway, here is a solution for you.
First I have created a ranking column based on date. The reason is that I don't know if your real dataset has patches of empty values or only a few empty rows at the end of the dataset. Either way, I need to fill it up based on the last known value with a growth factor of 1.02. Thus, a ranking will come in handy later:
Ranking = RANKX(Table1, Table1[Date], , ASC, Dense)Next, I created a calculated column with the following DAX:
Filled = IF(Table1[Value] = BLANK(),
    VAR _curRank = Table1[Ranking]
    VAR _lastNonBlankRank = MAXX(FILTER(table1, Table1[Ranking] < _curRank && Table1[Value] <> BLANK()), Table1[Ranking])
    VAR _lastNonBlankValue = LOOKUPVALUE('Table1'[Value], Table1[Ranking], _lastNonBlankRank)
    RETURN
    _lastNonBlankValue * POWER(1.02, _curRank - _lastNonBlankRank),
    Table1[Value])
Basically it returns the value in the [Value] column if there is one, but if there isn't we are going to do something special. First we store some variables, like current row ranking number, last ranking number that has a non-blank value in the [Value] column and the actual last non-blank value of the [Value] column. Then we return the last non-blank value * 1.02 ^ (thisrow ranking - last non blank ranking). This returns the following: (I changed the data layout to a maximum of 8 decimals so this would be easily compared to your example)
Let me know if this is clear and meets your requirements 🙂
Kind regards
Djerro123
-------------------------------
If this answered your question, please mark it as the Solution. This also helps others to find what they are looking for.
Keep those thumbs up coming! 🙂
Did I answer your question? Mark my post as a solution!
Proud to be a Super User!
- Mark as New
- Bookmark
- Subscribe
- Mute
- Subscribe to RSS Feed
- Permalink
- Report Inappropriate Content
Thank you.You have no idea how you saved my life after tons of research about this calculation
- Mark as New
- Bookmark
- Subscribe
- Mute
- Subscribe to RSS Feed
- Permalink
- Report Inappropriate Content
Hi @JarroVGIT ! Just wanted to say I used this solution (with a few tweaks) to figure out how to create average values falling in between week 52 of each year and week 1 of the next -- couldn't for the life of me figure it out, so really appreciate this!
Helpful resources
| User | Count |
|---|---|
| 14 | |
| 12 | |
| 8 | |
| 6 | |
| 5 |
| User | Count |
|---|---|
| 29 | |
| 18 | |
| 13 | |
| 8 | |
| 5 |


