Fabric Data Days starts November 4th!
Advance your Data & AI career with 50 days of live learning, dataviz contests, hands-on challenges, study groups & certifications and more!
Get registered- Power BI forums
- Get Help with Power BI
- Desktop
- Service
- Report Server
- Power Query
- Mobile Apps
- Developer
- DAX Commands and Tips
- Custom Visuals Development Discussion
- Health and Life Sciences
- Power BI Spanish forums
- Translated Spanish Desktop
- Training and Consulting
- Instructor Led Training
- Dashboard in a Day for Women, by Women
- Galleries
- Data Stories Gallery
- Themes Gallery
- Contests Gallery
- QuickViz Gallery
- Quick Measures Gallery
- Visual Calculations Gallery
- Notebook Gallery
- Translytical Task Flow Gallery
- TMDL Gallery
- R Script Showcase
- Webinars and Video Gallery
- Ideas
- Custom Visuals Ideas (read-only)
- Issues
- Issues
- Events
- Upcoming Events
Get Fabric Certified for FREE during Fabric Data Days. Don't miss your chance! Request now
- Power BI forums
- Forums
- Get Help with Power BI
- DAX Commands and Tips
- Re: Date Hierarchy shows Blanks in Visual
- Subscribe to RSS Feed
- Mark Topic as New
- Mark Topic as Read
- Float this Topic for Current User
- Bookmark
- Subscribe
- Printer Friendly Page
- Mark as New
- Bookmark
- Subscribe
- Mute
- Subscribe to RSS Feed
- Permalink
- Report Inappropriate Content
Date Hierarchy shows Blanks in Visual
Hello,
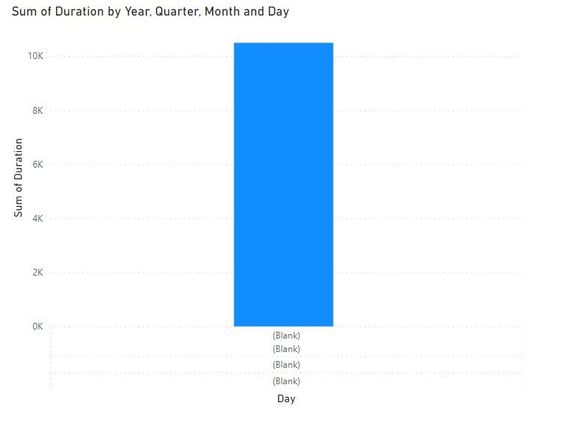
When I want to visualize [Duration] on a Date x-axis the visual doesn’t recognize the date hierarchy and I get (Blank) instead. See picture. How can I solve this to make it look like the last picture attached? I think I'm missing something basic...
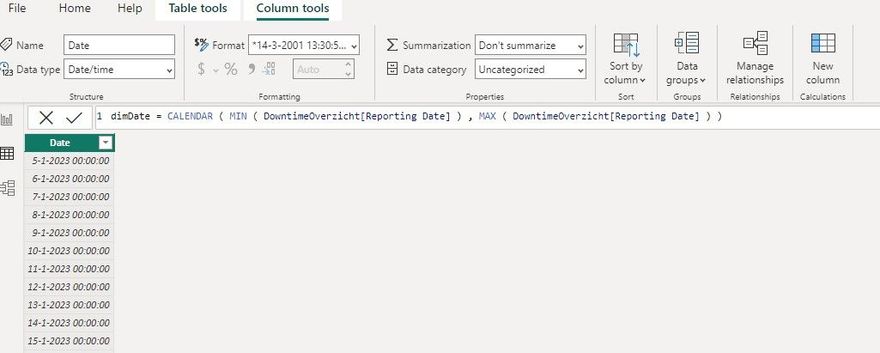
I created a Date Table using the following DAX:
This is the format of the original date in the FACT Table:
This is how I’ve set up the relationship between the [Date Table] and [Reporting Date]
When I just use [Duration] and [Reporting Date] from the same table I get the result I want, but I want to use the dimension table because I have to add new tables later on.
Thank you!
Solved! Go to Solution.
- Mark as New
- Bookmark
- Subscribe
- Mute
- Subscribe to RSS Feed
- Permalink
- Report Inappropriate Content
I see the problem in your screenshot: dimDate is DD-MM-YYYY 00:00:00 but in your FACT table: DD-MM-YYYY 06:00:00. They will not join via the relationsship.
You have to separate date and time in the fact and dim table.
Did I answer your question? Mark my post as a solution!
Proud to be a Super User!
- Mark as New
- Bookmark
- Subscribe
- Mute
- Subscribe to RSS Feed
- Permalink
- Report Inappropriate Content
Awesome thank you! I've adjusted the 6:00 to 0:00 in Power Query and now they match!
- Mark as New
- Bookmark
- Subscribe
- Mute
- Subscribe to RSS Feed
- Permalink
- Report Inappropriate Content
One advice. If you not need the time than separate it from the the date. One column for date, one for time. But fine that it works. 🙂
Did I answer your question? Mark my post as a solution!
Proud to be a Super User!
- Mark as New
- Bookmark
- Subscribe
- Mute
- Subscribe to RSS Feed
- Permalink
- Report Inappropriate Content
Do you have perhaps a .pbix file?
Did I answer your question? Mark my post as a solution!
Proud to be a Super User!
- Mark as New
- Bookmark
- Subscribe
- Mute
- Subscribe to RSS Feed
- Permalink
- Report Inappropriate Content
Yes, but how can I upload it to here?
Helpful resources

Fabric Data Days
Advance your Data & AI career with 50 days of live learning, contests, hands-on challenges, study groups & certifications and more!

Power BI Monthly Update - October 2025
Check out the October 2025 Power BI update to learn about new features.

| User | Count |
|---|---|
| 6 | |
| 6 | |
| 4 | |
| 4 | |
| 4 |
| User | Count |
|---|---|
| 24 | |
| 17 | |
| 10 | |
| 7 | |
| 6 |


