This is best Fabric, Power BI, SQL and AI community event. How do we know? The last event sold out! Save €200 with code FABCMTY200.
Register nowJuly 28 - August 9 | Final Round of the Power BI Dataviz World Championships. This is your chance. Learn more
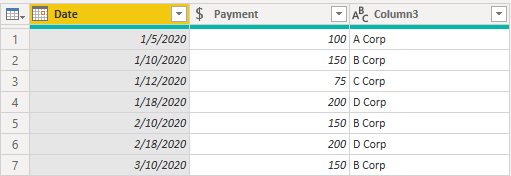
Source data table:
Rows 2 and 4 indicate multiple payments. B Corp to be paid $150 on 1/10, 2/10, and 3/10. D Corp to be paid $200 on 1/18 and 2/18. I'm looking for a DAX formula to produce the following calculated table from the source table above:
Thank you for your time and assistance.
Solved! Go to Solution.
Hi @bob57
You can create a table like below.
Table 2 =
SELECTCOLUMNS(
GENERATE(
'Table',
VAR __pumnts = 'Table'[No Pymnts]
RETURN
GENERATESERIES( 1, __pumnts, 1 )
),
"Date",
VAR __value = [Value] -1
VAR __date = 'Table'[Date]
VAR __year = YEAR( __date )
VAR __month = MONTH( __date ) + __value
VAR __day = DAY( __date )
RETURN
DATE( __year, __month, __day ),
"Payment", 'Table'[Payment],
"Vendor", 'Table'[Vendor]
)
Hi @bob57
You can create a table like below.
Table 2 =
SELECTCOLUMNS(
GENERATE(
'Table',
VAR __pumnts = 'Table'[No Pymnts]
RETURN
GENERATESERIES( 1, __pumnts, 1 )
),
"Date",
VAR __value = [Value] -1
VAR __date = 'Table'[Date]
VAR __year = YEAR( __date )
VAR __month = MONTH( __date ) + __value
VAR __day = DAY( __date )
RETURN
DATE( __year, __month, __day ),
"Payment", 'Table'[Payment],
"Vendor", 'Table'[Vendor]
)
Worked perfectly! Thank you. Now Ineed to learn how it works. Appreciate your effort.
Join us in Barcelona for FabCon and SQLCon, the Fabric, Power BI, SQL, and AI community event. Save €200 with code FABCMTY200.
Check out the July 2026 Power BI update to learn about new features.
| User | Count |
|---|---|
| 2 | |
| 2 | |
| 2 | |
| 1 | |
| 1 |