FabCon is coming to Atlanta
Join us at FabCon Atlanta from March 16 - 20, 2026, for the ultimate Fabric, Power BI, AI and SQL community-led event. Save $200 with code FABCOMM.
Register now!- Power BI forums
- Get Help with Power BI
- Desktop
- Service
- Report Server
- Power Query
- Mobile Apps
- Developer
- DAX Commands and Tips
- Custom Visuals Development Discussion
- Health and Life Sciences
- Power BI Spanish forums
- Translated Spanish Desktop
- Training and Consulting
- Instructor Led Training
- Dashboard in a Day for Women, by Women
- Galleries
- Data Stories Gallery
- Themes Gallery
- Contests Gallery
- QuickViz Gallery
- Quick Measures Gallery
- Visual Calculations Gallery
- Notebook Gallery
- Translytical Task Flow Gallery
- TMDL Gallery
- R Script Showcase
- Webinars and Video Gallery
- Ideas
- Custom Visuals Ideas (read-only)
- Issues
- Issues
- Events
- Upcoming Events
View all the Fabric Data Days sessions on demand. View schedule
- Power BI forums
- Forums
- Get Help with Power BI
- DAX Commands and Tips
- Conditional Rolling Average
- Subscribe to RSS Feed
- Mark Topic as New
- Mark Topic as Read
- Float this Topic for Current User
- Bookmark
- Subscribe
- Printer Friendly Page
- Mark as New
- Bookmark
- Subscribe
- Mute
- Subscribe to RSS Feed
- Permalink
- Report Inappropriate Content
Conditional Rolling Average
I have below mentioned Power BI table structure Table
WeightedVel table contains below columns
“Team_10202” as a String Data type
“Reporting Sprint ID” as an Integer Data type
“Story_Points_10004” as a Decimal Data type
Now, I need a calculated column in this table to get average of last six “Story_Points_10004”, ordered by “Reporting Sprint ID”, grouped by “Team_10202”
Ensure you include the value of the current row in this calculation
For e.g. if the data is like this ->
The output should be like this ->
Solved! Go to Solution.
- Mark as New
- Bookmark
- Subscribe
- Mute
- Subscribe to RSS Feed
- Permalink
- Report Inappropriate Content
Hi @yogeshk77 ,
Here are the steps you can follow:
1. Create calculated column.
rank =
RANKX(
    FILTER(ALL(Expected),
    'Expected'[Team]=EARLIER('Expected'[Team])),[Reporting Sprint ID],,DESC)
Sum of Six Period Average =
IF(
[rank] <=6,
AVERAGEX(
FILTER(ALL('Expected'),
'Expected'[Team]=EARLIER('Expected'[Team])&&
'Expected'[rank]>=EARLIER('Expected'[rank])&&'Expected'[rank]<=EARLIER('Expected'[rank])+5),[Story_Points])
)2. Result:
Best Regards,
Liu Yang
If this post helps, then please consider Accept it as the solution to help the other members find it more quickly
- Mark as New
- Bookmark
- Subscribe
- Mute
- Subscribe to RSS Feed
- Permalink
- Report Inappropriate Content
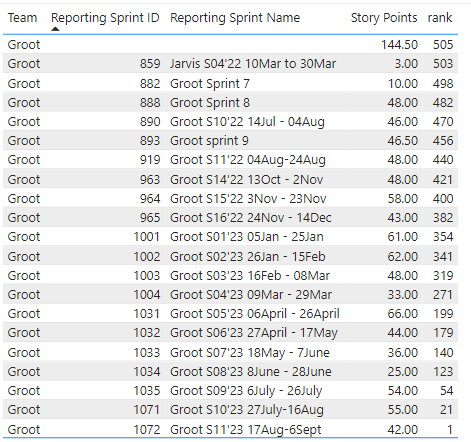
Thank you.. In the stand alone test PBI this works, but in practical I have multiple other teams and looks like due to that combination the rank function is not working as expected.
Here's the result from my actual PBI
- Mark as New
- Bookmark
- Subscribe
- Mute
- Subscribe to RSS Feed
- Permalink
- Report Inappropriate Content
You can check this file
I Need a calculated column in the table called "Data", which shows the output in the below table called "Expected Output"
- Mark as New
- Bookmark
- Subscribe
- Mute
- Subscribe to RSS Feed
- Permalink
- Report Inappropriate Content
@yogeshk77 Should be:
Column =
  VAR __Team = [Learnosity_Team_10202]
  VAR __Sprint = [Reporting Sprint ID]
  VAR __Sprints = SELECTCOLUMNS(FILTER('Table', [Learnosity_Team_10202] = __Team && [Reporting Sprint ID] <= __Sprint), "__SprintID", [Reporting Sprint ID])
  VAR __SprintsText = CONCATENATEX( __Sprints, [__SprintID], "|", [__SprintID], DESC)
  VAR __Table =
    ADDCOLUMNS(
      GENERATESERIES( 1, COUNTROWS(__Sprints), 1 ),
      "__SprintID", PATHITEM(__SprintsText, [Value])
    )
  VAR __FinalSprints = FILTER(__Table, [Value] <= 6)
  VAR __Result = AVERAGEX( FILTER('Table', [Reporting Sprint ID] IN __FinalSprints), [Sum of Story_Points_10004)
RETURN
  __Result
Quite possible that you will get some kind of error complaining about text vs. number. Also, couldn't test this so the probability of a syntax error is fairly high. If you provide your sample data as text, could test this in a PBIX file and provide the PBIX file to you.
Follow on LinkedIn
@ me in replies or I'll lose your thread!!!
Instead of a Kudo, please vote for this idea
Become an expert!: Enterprise DNA
External Tools: MSHGQM
YouTube Channel!: Microsoft Hates Greg
Latest book!: DAX For Humans
DAX is easy, CALCULATE makes DAX hard...
Helpful resources

Power BI Monthly Update - November 2025
Check out the November 2025 Power BI update to learn about new features.

Fabric Data Days
Advance your Data & AI career with 50 days of live learning, contests, hands-on challenges, study groups & certifications and more!

| User | Count |
|---|---|
| 19 | |
| 11 | |
| 9 | |
| 4 | |
| 4 |
| User | Count |
|---|---|
| 31 | |
| 27 | |
| 21 | |
| 13 | |
| 12 |


