FabCon is coming to Atlanta
Join us at FabCon Atlanta from March 16 - 20, 2026, for the ultimate Fabric, Power BI, AI and SQL community-led event. Save $200 with code FABCOMM.
Register now!- Power BI forums
- Get Help with Power BI
- Desktop
- Service
- Report Server
- Power Query
- Mobile Apps
- Developer
- DAX Commands and Tips
- Custom Visuals Development Discussion
- Health and Life Sciences
- Power BI Spanish forums
- Translated Spanish Desktop
- Training and Consulting
- Instructor Led Training
- Dashboard in a Day for Women, by Women
- Galleries
- Data Stories Gallery
- Themes Gallery
- Contests Gallery
- QuickViz Gallery
- Quick Measures Gallery
- Visual Calculations Gallery
- Notebook Gallery
- Translytical Task Flow Gallery
- TMDL Gallery
- R Script Showcase
- Webinars and Video Gallery
- Ideas
- Custom Visuals Ideas (read-only)
- Issues
- Issues
- Events
- Upcoming Events
The Power BI Data Visualization World Championships is back! Get ahead of the game and start preparing now! Learn more
- Power BI forums
- Forums
- Get Help with Power BI
- DAX Commands and Tips
- Combining Values to Display in a Line Chart
- Subscribe to RSS Feed
- Mark Topic as New
- Mark Topic as Read
- Float this Topic for Current User
- Bookmark
- Subscribe
- Printer Friendly Page
- Mark as New
- Bookmark
- Subscribe
- Mute
- Subscribe to RSS Feed
- Permalink
- Report Inappropriate Content
Combining Values to Display in a Line Chart
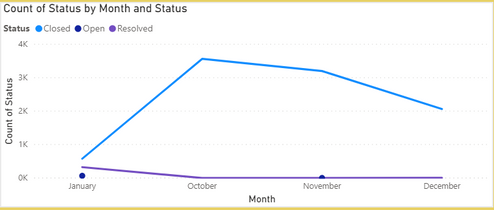
I am new to Power BI, and have a line chart that I would like to display the tickets that are marked with the status: Open and Closed/Resolved. Closed and Resolved are different statuses, however I would like to combine the values for each month's number of tickets marked as this because they basically have the same meaning.
How do I combine the Closed & Resolved values, so that it only displays as a single line instead of 2 separate ones (as shown below)?
I would appreciate your help!
Solved! Go to Solution.
- Mark as New
- Bookmark
- Subscribe
- Mute
- Subscribe to RSS Feed
- Permalink
- Report Inappropriate Content
works fine for me, can you share how you writed the dax?
Did I answer your question? Mark my post as a solution! / Did it help? Give some Kudos!
Proud to be a Super User!
- Mark as New
- Bookmark
- Subscribe
- Mute
- Subscribe to RSS Feed
- Permalink
- Report Inappropriate Content
hey try a measure like this:
measure = calculated(sum(columnvalue),status="Closed") + calculated(sum(columnvalue),status="Resolved")
if this solved your question please give some kudos and mark as solution for others to find it.
Did I answer your question? Mark my post as a solution! / Did it help? Give some Kudos!
Proud to be a Super User!
- Mark as New
- Bookmark
- Subscribe
- Mute
- Subscribe to RSS Feed
- Permalink
- Report Inappropriate Content
Hi Stefano, if I used calculate I get the error: "A function 'CALCULATE' has been used in a True/False expression that is used as a table filter expression. This is not allowed."
Same with FILTER:
"function 'FILTER' has been used in a True/False expression that is used as a table filter expression. This is not allowed."
I have used this:
ClosedResolved = CALCULATE(SUM('Tickets'[Status]), FILTER ('Tickets', 'Tickets'[Status] = "Closed") + CALCULATE(SUM('Tickets'[Status]), FILTER ('Tickets', 'Tickets'[Status] = "Resolved")))
- Mark as New
- Bookmark
- Subscribe
- Mute
- Subscribe to RSS Feed
- Permalink
- Report Inappropriate Content
works fine for me, can you share how you writed the dax?
Did I answer your question? Mark my post as a solution! / Did it help? Give some Kudos!
Proud to be a Super User!
- Mark as New
- Bookmark
- Subscribe
- Mute
- Subscribe to RSS Feed
- Permalink
- Report Inappropriate Content
Thanks for your help, it works now! I changed it from SUM to COUNT:
Closed & Resolved = CALCULATE(COUNT('Tickets'[Status]), 'Tickets'[Status] = "Closed") + CALCULATE(COUNT('Tickets'[Status]), 'Tickets'[Status] = "Resolved")Helpful resources

Power BI Dataviz World Championships
The Power BI Data Visualization World Championships is back! Get ahead of the game and start preparing now!

Power BI Monthly Update - November 2025
Check out the November 2025 Power BI update to learn about new features.

| User | Count |
|---|---|
| 20 | |
| 10 | |
| 9 | |
| 4 | |
| 4 |
| User | Count |
|---|---|
| 33 | |
| 31 | |
| 19 | |
| 12 | |
| 11 |


