Join us at FabCon Vienna from September 15-18, 2025
The ultimate Fabric, Power BI, SQL, and AI community-led learning event. Save €200 with code FABCOMM.
Get registered- Power BI forums
- Get Help with Power BI
- Desktop
- Service
- Report Server
- Power Query
- Mobile Apps
- Developer
- DAX Commands and Tips
- Custom Visuals Development Discussion
- Health and Life Sciences
- Power BI Spanish forums
- Translated Spanish Desktop
- Training and Consulting
- Instructor Led Training
- Dashboard in a Day for Women, by Women
- Galleries
- Data Stories Gallery
- Themes Gallery
- Contests Gallery
- Quick Measures Gallery
- Notebook Gallery
- Translytical Task Flow Gallery
- TMDL Gallery
- R Script Showcase
- Webinars and Video Gallery
- Ideas
- Custom Visuals Ideas (read-only)
- Issues
- Issues
- Events
- Upcoming Events
Enhance your career with this limited time 50% discount on Fabric and Power BI exams. Ends September 15. Request your voucher.
- Power BI forums
- Forums
- Get Help with Power BI
- DAX Commands and Tips
- Re: Calculated column Shows Repeated Values
- Subscribe to RSS Feed
- Mark Topic as New
- Mark Topic as Read
- Float this Topic for Current User
- Bookmark
- Subscribe
- Printer Friendly Page
- Mark as New
- Bookmark
- Subscribe
- Mute
- Subscribe to RSS Feed
- Permalink
- Report Inappropriate Content
Calculated column Shows Repeated Values
Hello All,
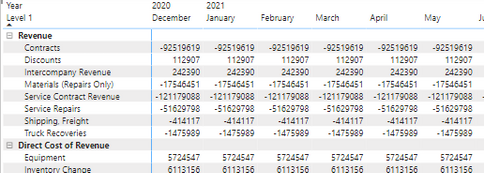
I am working on a measure but im getting repeated values across all the months, can you please assist on what I am missing on the dax commands? Thank you!!
I am using the following measure DAX
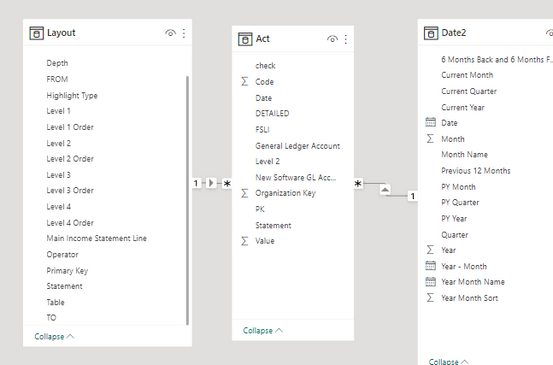
Relationships on Layout to Act on Primary Key (PK) and Act to Date2 on Date
Act Table
Layout Table
| Statement | Level 1 | Level 2 | Primary Key | Calculation | Table | FROM | TO | Highlight Type | Operator | Main Income Statement Line | Blank Line | Depth |
| Income Statement | Revenue | Contracts | 186 | SUM | 186 | 186 | 1 | 1 | TRUE | 2 | ||
| Income Statement | Revenue | Materials (Repairs Only) | 187 | SUM | 187 | 187 | 1 | 1 | TRUE | 2 | ||
| Income Statement | Revenue | Shipping, Freight | 188 | SUM | 188 | 188 | 1 | 1 | TRUE | 2 | ||
| Income Statement | Revenue | Service Repairs | 189 | SUM | 189 | 189 | 1 | 1 | TRUE | 2 | ||
| Income Statement | Revenue | Discounts | 190 | SUM | 190 | 190 | 1 | 1 | TRUE | 2 |
- Mark as New
- Bookmark
- Subscribe
- Mute
- Subscribe to RSS Feed
- Permalink
- Report Inappropriate Content
There is a difference between a calculated column (calculated once for each row) and a measure (calculated dynamically for each filter context change).
Please provide sanitized sample data that fully covers your issue.
https://community.powerbi.com/t5/Community-Blog/How-to-provide-sample-data-in-the-Power-BI-Forum/ba-...
Please show the expected outcome based on the sample data you provided.
https://community.powerbi.com/t5/Desktop/How-to-Get-Your-Question-Answered-Quickly/m-p/1447523
- Mark as New
- Bookmark
- Subscribe
- Mute
- Subscribe to RSS Feed
- Permalink
- Report Inappropriate Content
Hello,
Thank you for assisting me on this, see below
Sample file link below:
Desired Outcome
| Level 2 | 9/30/2022 | 10/31/2022 |
| Contracts | -100000 | -100000 |
| Subcontractor expense | 25000 | 50000 |
| Gross Profit | -75000 | -50000 |
Current outcome
Tables
Data:
| Organization Key | Statement | FSLI | DETAILED | Level 2 | PK | Code | 9/30/2022 | 10/31/2022 | |
| 1 | Income Statement | Net Revenue | Contracts | Contracts | 186 | 4000 | -100000 | -100000 | |
| 1 | Income Statement | Cost of Goods Sold | Subcontractor expense | Subcontractor expense | 203 | 5005 | 25000 | 50000 |
Layout Table
| Statement | Level 1 | Level 2 | Primary Key | Calculation | Table | FROM | TO |
| Income Statement | Revenue | Contracts | 186 | SUM | 186 | 186 | |
| Income Statement | Direct Cost of Revenue | Subcontractor expense | 203 | SUM | 203 | 203 | |
| Income Statement | Gross Profit | Gross Profit | 222 | CALCULATION | 186 | 203 |
- Mark as New
- Bookmark
- Subscribe
- Mute
- Subscribe to RSS Feed
- Permalink
- Report Inappropriate Content
Your Layout[FROM] and Layout[TO] values are numeric. Did you mean to specify date ranges instead?
Replace the item SUBTOTAL field with the Value field:
- Mark as New
- Bookmark
- Subscribe
- Mute
- Subscribe to RSS Feed
- Permalink
- Report Inappropriate Content
I am trying to have the Item subtotal formula use the primary Key which is numeric to do the corresponding additions based on the PK from and to so for example PK 186 is revenue, PK 203 is cost of goods sold and PK 222 gross margin should be the addition of the values for PK 186 through PK 203. hope this helps clarify, Thank you for your assistance
Helpful resources
| User | Count |
|---|---|
| 14 | |
| 11 | |
| 6 | |
| 6 | |
| 5 |
| User | Count |
|---|---|
| 28 | |
| 17 | |
| 11 | |
| 7 | |
| 5 |


