Hi everyone,
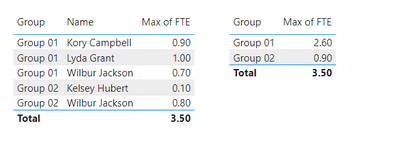
I am looking for a measure "SumOfMaxFTE" that will Sum the Max of all [FTE] by [Name] and [Group].
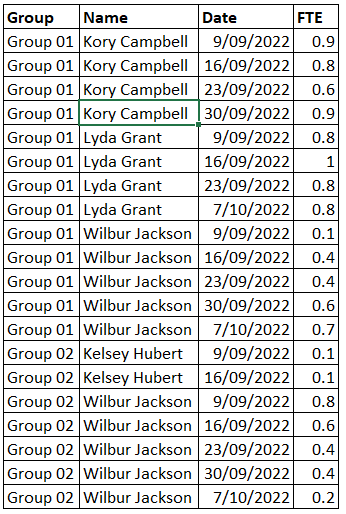
Here is my source data having [Group], [Name], [Date], and [FTE]
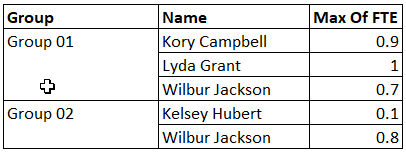
Summarizing the above by [Group], [Name], and Max([FTE]), I get the following
Summarizing the above further by [Group] and Sum(Max of FTE), I get the following

Thank you in advance for your help in coming up with a SumOfMaxOfFTE measure.
Here is the datasource in text
| Name | Group | Date | FTE |
| Kory Campbell | Group 01 | 9/09/2022 | 0.9 |
| Kory Campbell | Group 01 | 16/09/2022 | 0.8 |
| Kory Campbell | Group 01 | 23/09/2022 | 0.6 |
| Kory Campbell | Group 01 | 30/09/2022 | 0.9 |
| Wilbur Jackson | Group 01 | 9/09/2022 | 0.1 |
| Wilbur Jackson | Group 01 | 16/09/2022 | 0.4 |
| Wilbur Jackson | Group 01 | 23/09/2022 | 0.4 |
| Wilbur Jackson | Group 01 | 30/09/2022 | 0.6 |
| Wilbur Jackson | Group 01 | 7/10/2022 | 0.7 |
| Wilbur Jackson | Group 02 | 9/09/2022 | 0.8 |
| Wilbur Jackson | Group 02 | 16/09/2022 | 0.6 |
| Wilbur Jackson | Group 02 | 23/09/2022 | 0.4 |
| Wilbur Jackson | Group 02 | 30/09/2022 | 0.4 |
| Wilbur Jackson | Group 02 | 7/10/2022 | 0.2 |
| Kelsey Hubert | Group 02 | 9/09/2022 | 0.1 |
| Kelsey Hubert | Group 02 | 16/09/2022 | 0.1 |
| Lyda Grant | Group 01 | 9/09/2022 | 0.8 |
| Lyda Grant | Group 01 | 16/09/2022 | 1 |
| Lyda Grant | Group 01 | 23/09/2022 | 0.8 |
| Lyda Grant | Group 01 | 7/10/2022 | 0.8 |
Cheers and God bless!