cancel
Showing results for 
Search instead for 
Did you mean: 

July 28 - August 9 | Final Round of the Power BI Dataviz World Championships. This is your chance. Learn more

Reply
Anonymous
Not applicable

Set a user-defined title to a custom R HTML visual

Hello,


  I'm using pbiviz to do some custom R HTML visuals. With capabilities.json, I'm able to control the dataset(s) exported from Power BI to the the R script (their names and their display names). But is it possible to export say a string to use as a title of the graphic? (for example if I use ggplot with ggtitle followed by ggploty). I mean a string that the user is able to choose.

1 ACCEPTED SOLUTION
Anonymous
Not applicable

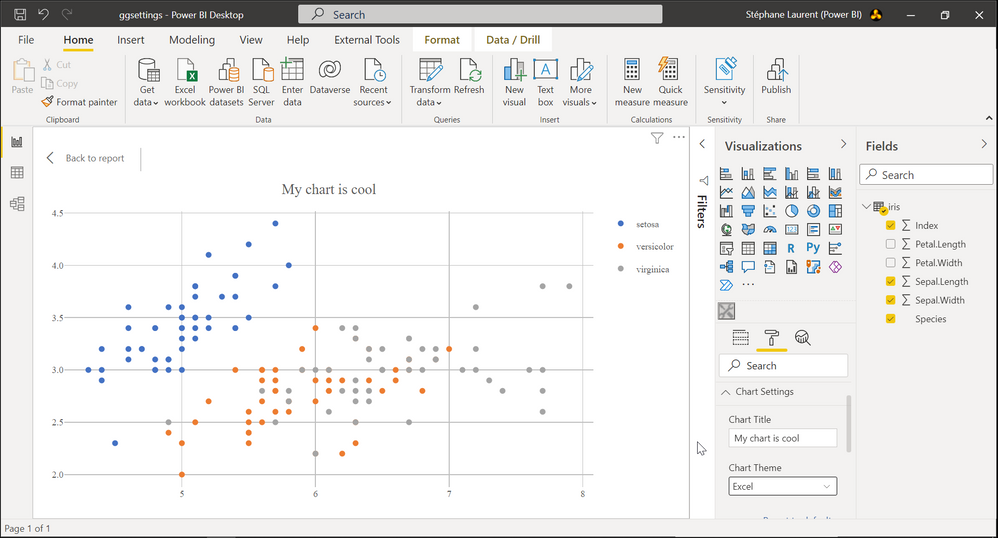
I managed to add a text input for setting a title and a dropdown list for setting a chart theme:


ggsettings.png


This is achieved by modifying two files: the file capabilities.json and the file src/settings.ts in the folder created by pbiviz.

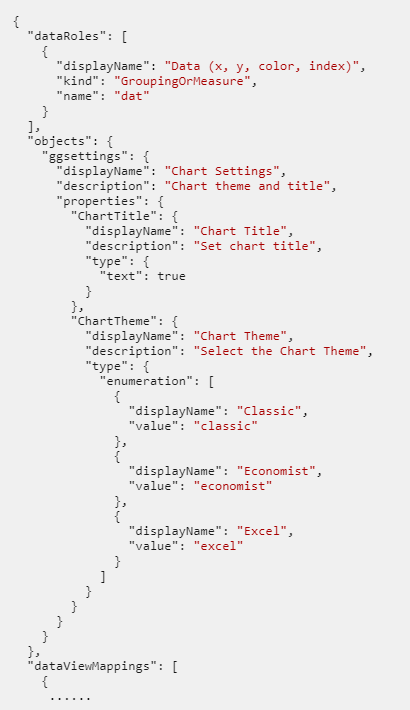
Here is the file capabilities.json. I modified the objects node:


ggsettings_capabilitiesjson.png

And here is the TypeScript file src/settings.ts:


ggsettings_settingsts.png


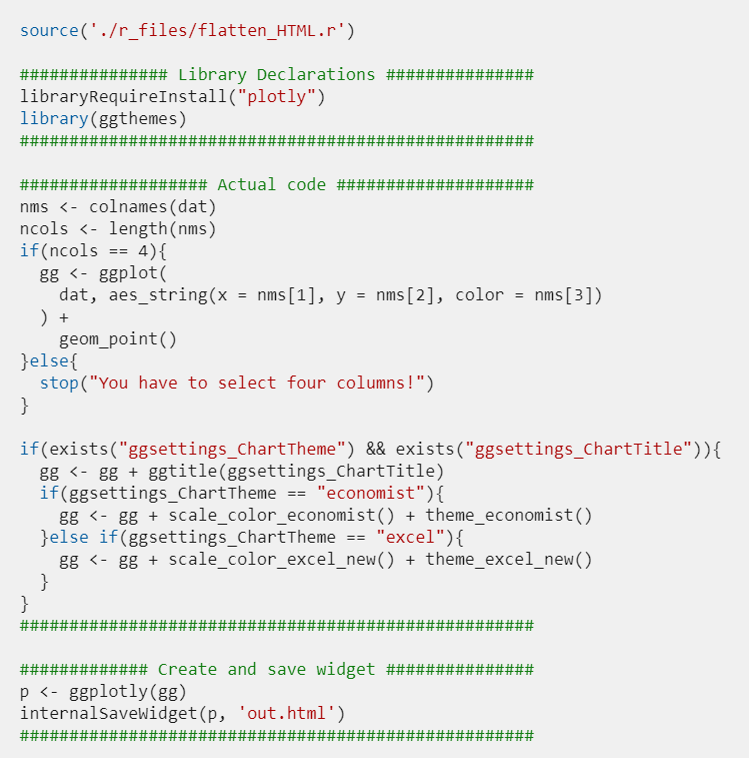
Then, in the file script.r, the title set by the user and the theme he chooses are named ggsettings_ChartTitle and ggsettings_ChartTheme respectively. But they won't be available at the first creation of the chart, so we have to check for their existence in the R script. Here is the full script I used:


ggsettings_script.png

View solution in original post

1 REPLY 1
Anonymous
Not applicable

I managed to add a text input for setting a title and a dropdown list for setting a chart theme:


ggsettings.png


This is achieved by modifying two files: the file capabilities.json and the file src/settings.ts in the folder created by pbiviz.

Here is the file capabilities.json. I modified the objects node:


ggsettings_capabilitiesjson.png

And here is the TypeScript file src/settings.ts:


ggsettings_settingsts.png


Then, in the file script.r, the title set by the user and the theme he chooses are named ggsettings_ChartTitle and ggsettings_ChartTheme respectively. But they won't be available at the first creation of the chart, so we have to check for their existence in the R script. Here is the full script I used:


ggsettings_script.png

Helpful resources

Announcements
FabCon and SQLCon Barcelona 2026

FabCon & SQLCon – Barcelona 2026

Join us in Barcelona for FabCon and SQLCon, the Fabric, Power BI, SQL, and AI community event. Save €200 with code FABCMTY200.

Fabric Community Sticker Design Challenge Barcelona Carousel

Fabric Community Sticker Challenge - Barcelona 2026

If you love stickers, then you will definitely want to check out our community sticker challenge, Barcelona edition!

July Power BI Update Carousel

Power BI Monthly Update - July 2026

Check out the July 2026 Power BI update to learn about new features.

Power BI DataViz World Championships carousel

Power BI DataViz World Championships - June 2026

A new Power BI DataViz World Championship is coming this June! Don't miss out on submitting your entry.