
Get certified for free when you join Fabric Data Days 2026 and dive into Fabric, Power BI, SQL, AI, and other essential data skills.
Join nowJuly 28 - August 9 | Final Round of the Power BI Dataviz World Championships. This is your chance. Learn more
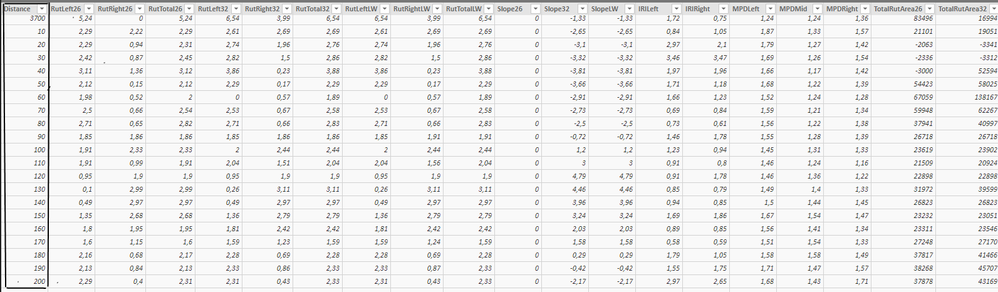
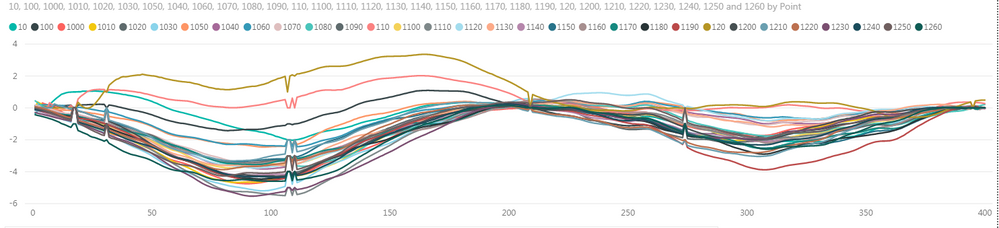
Hi. My problem is that I'd like to to connect two tables and I just don't know to do it. In the other table the distance is it's own column and in the other table the distances (10, 20, 30 etc) are the columns. I have to use distances as columns, because I wan't to draw a line from the points that specific distance has. I want to create a connection between these two, because I want to highlight some details from a chart made from 2. table when a value is chosen from the 1. table. Do you have any ideas how I should do this? Thanks in advance:)1 Table.
2. Table
Chart from 1 table ( creates surface from points)
Hi,
I am not sure that I understood what exactly you want to do but you can use DAX to adjust your data.
Kind Regards,
Evgenii Elkin,
Software Engineer
Microsoft Power BI Custom Visuals
[email protected]
Join us in Barcelona for FabCon and SQLCon, the Fabric, Power BI, SQL, and AI community event. Save €200 with code FABCMTY200.
If you love stickers, then you will definitely want to check out our community sticker challenge, Barcelona edition!
Check out the July 2026 Power BI update to learn about new features.