
Get certified for free when you join Fabric Data Days 2026 and dive into Fabric, Power BI, SQL, AI, and other essential data skills.
Join nowJuly 28 - August 9 | Final Round of the Power BI Dataviz World Championships. This is your chance. Learn more
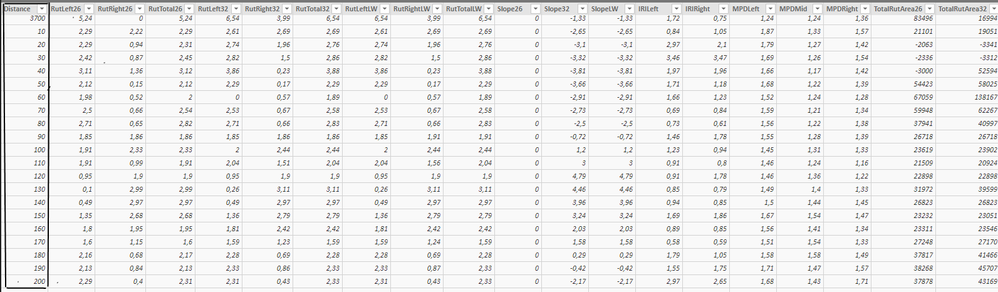
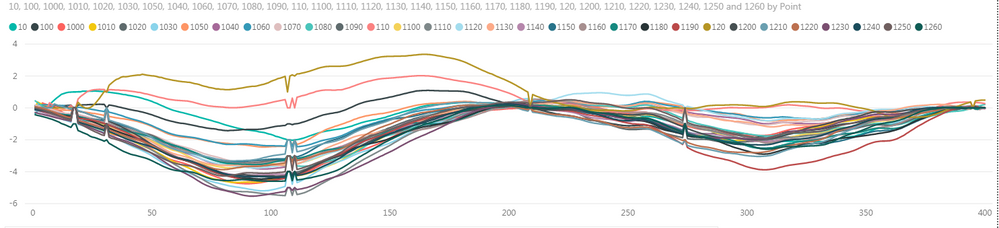
Hi. My problem is that I'd like to to connect two tables and I just don't know to do it. In the other table the distance is it's own column and in the other table the distances (10, 20, 30 etc) are the columns. I have to use distances as columns, because I wan't to draw a line from the points that specific distance has. I want to create a connection between these two, because I want to highlight some details from a chart made from 2. table when a value is chosen from the 1. table. Do you have any ideas how I should do this? Thanks in advance:)1 Table.
2. Table
Chart from 1 table ( creates surface from points)
Hi,
I am not sure that I understood what exactly you want to do but you can use DAX to adjust your data.
Kind Regards,
Evgenii Elkin,
Software Engineer
Microsoft Power BI Custom Visuals
[email protected]
If you love stickers, then you will definitely want to check out our community sticker challenge, Barcelona edition!
Check out the July 2026 Power BI update to learn about new features.