Get certified for free when you join Fabric Data Days 2026 and dive into Fabric, Power BI, SQL, AI, and other essential data skills.
Join nowJuly 28 - August 9 | Final Round of the Power BI Dataviz World Championships. This is your chance. Learn more
Hi,
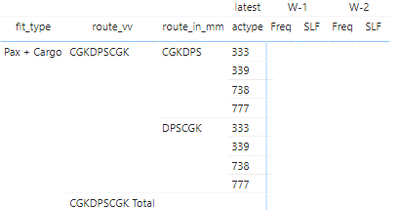
I have created matrix visualization like below.
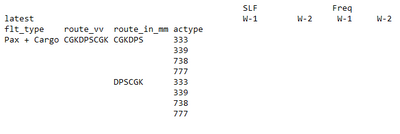
But, I need to move the latest (W-1,W-2) under each of Freq and SLF. Also I need to make it W-1 first and then W-2. Here I attached an example for what visualization I want.
Could anyone help me on this case please?
Thanks in advance 🙂
Please provide sanitized sample data that fully covers your issue.
https://community.powerbi.com/t5/Community-Blog/How-to-provide-sample-data-in-the-Power-BI-Forum/ba-...
Please show the expected outcome based on the sample data you provided.
https://community.powerbi.com/t5/Desktop/How-to-Get-Your-Question-Answered-Quickly/m-p/1447523
If you love stickers, then you will definitely want to check out our community sticker challenge, Barcelona edition!
Check out the July 2026 Power BI update to learn about new features.