Fabric Data Days starts November 4th!
Advance your Data & AI career with 50 days of live learning, dataviz contests, hands-on challenges, study groups & certifications and more!
Get registered- Power BI forums
- Get Help with Power BI
- Desktop
- Service
- Report Server
- Power Query
- Mobile Apps
- Developer
- DAX Commands and Tips
- Custom Visuals Development Discussion
- Health and Life Sciences
- Power BI Spanish forums
- Translated Spanish Desktop
- Training and Consulting
- Instructor Led Training
- Dashboard in a Day for Women, by Women
- Galleries
- Data Stories Gallery
- Themes Gallery
- Contests Gallery
- QuickViz Gallery
- Quick Measures Gallery
- Visual Calculations Gallery
- Notebook Gallery
- Translytical Task Flow Gallery
- TMDL Gallery
- R Script Showcase
- Webinars and Video Gallery
- Ideas
- Custom Visuals Ideas (read-only)
- Issues
- Issues
- Events
- Upcoming Events
Get Fabric Certified for FREE during Fabric Data Days. Don't miss your chance! Request now
- Power BI forums
- Forums
- Get Help with Power BI
- Service
- Re: Paginated Report Hidden columns and toggle ren...
- Subscribe to RSS Feed
- Mark Topic as New
- Mark Topic as Read
- Float this Topic for Current User
- Bookmark
- Subscribe
- Printer Friendly Page
- Mark as New
- Bookmark
- Subscribe
- Mute
- Subscribe to RSS Feed
- Permalink
- Report Inappropriate Content
Paginated Report Hidden columns and toggle rendering improperly once published
I have a paginated report I developed that has some groups and a toggle.
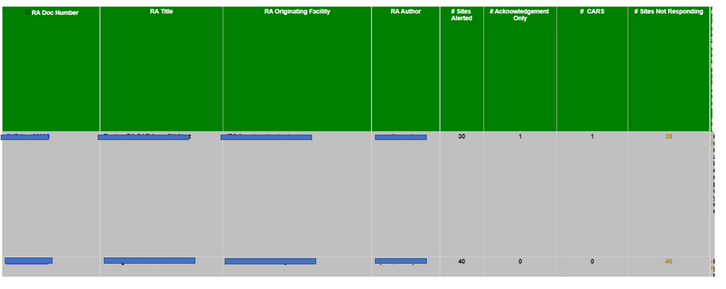
When I run the report in report builder it works perfectly. There are hidden columns with a blue colored header to the right that appear when I hit the + sign and everything is in a nice row. Below is shown collapsed.
When I publish to Powerbi.com however and run it, it renders really funky. Almost like the green columns are duplicated and word wrapped. I cannot figure out how to stop this behavior once published.
- Mark as New
- Bookmark
- Subscribe
- Mute
- Subscribe to RSS Feed
- Permalink
- Report Inappropriate Content
I was able to solve my problem by running the report in the Power BI Service and under the file menu disabling the preview features (see image, highlighted part previously said disable preview features).
However, it seems as though every user would have to go in and disable this setting for the report to render correctly for them which is unacceptable. Is there any workaround to this?
- Mark as New
- Bookmark
- Subscribe
- Mute
- Subscribe to RSS Feed
- Permalink
- Report Inappropriate Content
As an update, I opened a ticket with Microsoft and they are looking into the issue here. I will update with any information I find out.
Update 1/13/2023: Microsoft was able to recreate the bug on their end and they have confirmed this is a bug. They are working on their end on a fix. They will provide me with an ETA soon but typically it takes 3-5 weeks.
- Mark as New
- Bookmark
- Subscribe
- Mute
- Subscribe to RSS Feed
- Permalink
- Report Inappropriate Content
- Mark as New
- Bookmark
- Subscribe
- Mute
- Subscribe to RSS Feed
- Permalink
- Report Inappropriate Content
HI @rbrocks
Can you confirm that you are using the latest version of Power BI Paginated reports?
You can download the latest version here: What are paginated reports in Power BI? - Power BI | Microsoft Learn
- Mark as New
- Bookmark
- Subscribe
- Mute
- Subscribe to RSS Feed
- Permalink
- Report Inappropriate Content
Hi @GilbertQ thank you for the suggestion. It turns out I was not using the most updated version. I apparently have two versions, one from the store and one I downloaded. The one that the file was opened with was not updated.
I did update my version, opened the file again, and republished but the issue remains in the service.
Helpful resources

Fabric Data Days
Advance your Data & AI career with 50 days of live learning, contests, hands-on challenges, study groups & certifications and more!

Power BI Monthly Update - October 2025
Check out the October 2025 Power BI update to learn about new features.

| User | Count |
|---|---|
| 50 | |
| 18 | |
| 11 | |
| 11 | |
| 10 |


