Fabric Data Days starts November 4th!
Advance your Data & AI career with 50 days of live learning, dataviz contests, hands-on challenges, study groups & certifications and more!
Get registered- Power BI forums
- Get Help with Power BI
- Desktop
- Service
- Report Server
- Power Query
- Mobile Apps
- Developer
- DAX Commands and Tips
- Custom Visuals Development Discussion
- Health and Life Sciences
- Power BI Spanish forums
- Translated Spanish Desktop
- Training and Consulting
- Instructor Led Training
- Dashboard in a Day for Women, by Women
- Galleries
- Data Stories Gallery
- Themes Gallery
- Contests Gallery
- QuickViz Gallery
- Quick Measures Gallery
- Visual Calculations Gallery
- Notebook Gallery
- Translytical Task Flow Gallery
- TMDL Gallery
- R Script Showcase
- Webinars and Video Gallery
- Ideas
- Custom Visuals Ideas (read-only)
- Issues
- Issues
- Events
- Upcoming Events
Get Fabric Certified for FREE during Fabric Data Days. Don't miss your chance! Request now
- Power BI forums
- Forums
- Get Help with Power BI
- Service
- Re: Calculating number of non unique values
- Subscribe to RSS Feed
- Mark Topic as New
- Mark Topic as Read
- Float this Topic for Current User
- Bookmark
- Subscribe
- Printer Friendly Page

- Mark as New
- Bookmark
- Subscribe
- Mute
- Subscribe to RSS Feed
- Permalink
- Report Inappropriate Content
Calculating number of non unique values
Hello,
I am being puzzled with a solution here. I have a table with 2 columns, one of them shows the date when the date snapshot was taken the other shows a process if it was running:
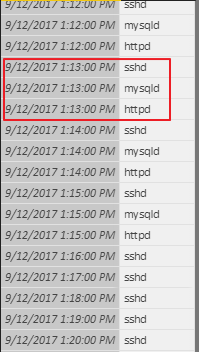
If all 3 processes are running at the same time we can say that the application is 100% available, if only 2 or 1 processes running we can say that the application is not available. I would like to see an output like this:
9/12/2017 1:13:00 PM | 3
9/12/2017 1:14:00 PM | 3
9/12/2017 1:15:00 PM | 3
9/12/2017 1:16:00 PM | 1
9/12/2017 1:17:00 PM | 1
9/12/2017 1:16:00 PM | 1
9/12/2017 1:18:00 PM | 1
Any help would be greatly appreciated.
Solved! Go to Solution.
- Mark as New
- Bookmark
- Subscribe
- Mute
- Subscribe to RSS Feed
- Permalink
- Report Inappropriate Content
Hi @zoveress,
Based on your description, I think summarize function will suitable for your requirement.
Use the data column as the group column, then summary stats column by distinct count function.
Table formula:
Summary table= SUMMARIZE('Table','Table'[DateTime],"Distinct",DISTINCTCOUNT('Table'[Status]))
Regards,
Xiaoxin Sheng


- Mark as New
- Bookmark
- Subscribe
- Mute
- Subscribe to RSS Feed
- Permalink
- Report Inappropriate Content
You want DISTINCTCOUNT: https://msdn.microsoft.com/en-us/library/gg492142.aspx
Follow on LinkedIn
@ me in replies or I'll lose your thread!!!
Instead of a Kudo, please vote for this idea
Become an expert!: Enterprise DNA
External Tools: MSHGQM
YouTube Channel!: Microsoft Hates Greg
Latest book!: DAX For Humans
DAX is easy, CALCULATE makes DAX hard...
- Mark as New
- Bookmark
- Subscribe
- Mute
- Subscribe to RSS Feed
- Permalink
- Report Inappropriate Content
I got that far myself I just do not know how to group the counts by date?
- Mark as New
- Bookmark
- Subscribe
- Mute
- Subscribe to RSS Feed
- Permalink
- Report Inappropriate Content
Just create a table visualization and put your date and your measure in it. It will group automagically. Or, you could use SUMMARIZE to create a new table.
Follow on LinkedIn
@ me in replies or I'll lose your thread!!!
Instead of a Kudo, please vote for this idea
Become an expert!: Enterprise DNA
External Tools: MSHGQM
YouTube Channel!: Microsoft Hates Greg
Latest book!: DAX For Humans
DAX is easy, CALCULATE makes DAX hard...
- Mark as New
- Bookmark
- Subscribe
- Mute
- Subscribe to RSS Feed
- Permalink
- Report Inappropriate Content
I actually have 1470 unique dates. I need all of them grouped. I need a new table with the 1470 unique dates and the number of processes active at that time next to them. By the way I am new to this so any help code-wise would be appreciated. Like this:
9/12/2017 1:13:00 PM | 3
9/12/2017 1:14:00 PM | 3
9/12/2017 1:15:00 PM | 3
9/12/2017 1:16:00 PM | 1
9/12/2017 1:17:00 PM | 1
9/12/2017 1:16:00 PM | 1
9/12/2017 1:18:00 PM | 1
...... 1470
In SQL you would use count and groupby but what is the syntax for DAX?
- Mark as New
- Bookmark
- Subscribe
- Mute
- Subscribe to RSS Feed
- Permalink
- Report Inappropriate Content
Hi @zoveress,
Based on your description, I think summarize function will suitable for your requirement.
Use the data column as the group column, then summary stats column by distinct count function.
Table formula:
Summary table= SUMMARIZE('Table','Table'[DateTime],"Distinct",DISTINCTCOUNT('Table'[Status]))
Regards,
Xiaoxin Sheng
- Mark as New
- Bookmark
- Subscribe
- Mute
- Subscribe to RSS Feed
- Permalink
- Report Inappropriate Content
Many thanks for the answer we are half way there. Now it creates a list of dates but doesn't count the processes correctly. It counts 3 even if only one process was running at that time. Any ideas? 🙂

- Mark as New
- Bookmark
- Subscribe
- Mute
- Subscribe to RSS Feed
- Permalink
- Report Inappropriate Content
Oh sorry my bad I used a different table for the second value, it works now with the following formula:
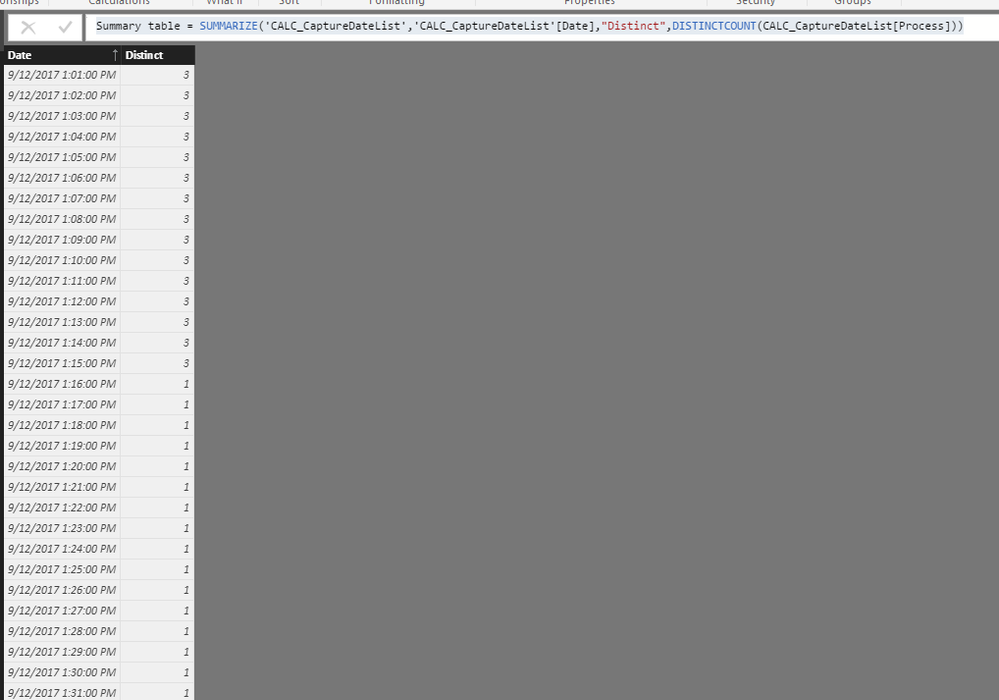
Summary table = SUMMARIZE('CALC_CaptureDateList','CALC_CaptureDateList'[Date],"Distinct",DISTINCTCOUNT(CALC_CaptureDateList[Process]))
Many thanks for the help!

Helpful resources

Fabric Data Days
Advance your Data & AI career with 50 days of live learning, contests, hands-on challenges, study groups & certifications and more!

Power BI Monthly Update - October 2025
Check out the October 2025 Power BI update to learn about new features.

FabCon Atlanta 2026
Join us at FabCon Atlanta, March 16-20, for the ultimate Fabric, Power BI, AI and SQL community-led event. Save $200 with code FABCOMM.


