Fabric Data Days starts November 4th!
Advance your Data & AI career with 50 days of live learning, dataviz contests, hands-on challenges, study groups & certifications and more!
Get registered- Power BI forums
- Get Help with Power BI
- Desktop
- Service
- Report Server
- Power Query
- Mobile Apps
- Developer
- DAX Commands and Tips
- Custom Visuals Development Discussion
- Health and Life Sciences
- Power BI Spanish forums
- Translated Spanish Desktop
- Training and Consulting
- Instructor Led Training
- Dashboard in a Day for Women, by Women
- Galleries
- Data Stories Gallery
- Themes Gallery
- Contests Gallery
- Quick Measures Gallery
- Visual Calculations Gallery
- Notebook Gallery
- Translytical Task Flow Gallery
- TMDL Gallery
- R Script Showcase
- Webinars and Video Gallery
- Ideas
- Custom Visuals Ideas (read-only)
- Issues
- Issues
- Events
- Upcoming Events
Get Fabric Certified for FREE during Fabric Data Days. Don't miss your chance! Learn more
- Power BI forums
- Forums
- Get Help with Power BI
- Report Server
- Long time of webpack compiling
- Subscribe to RSS Feed
- Mark Topic as New
- Mark Topic as Read
- Float this Topic for Current User
- Bookmark
- Subscribe
- Printer Friendly Page
- Mark as New
- Bookmark
- Subscribe
- Mute
- Subscribe to RSS Feed
- Permalink
- Report Inappropriate Content
Long time of webpack compiling
Hi there!
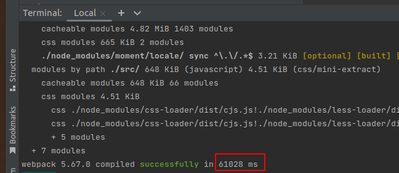
I'm working from Ukraine and average compiling time is 60-90 seconds.
A few months ago, build time was taking around 20-25 seconds.
I guess reason is in relocating servers on Microsoft side.
@dm-p Could you help me with it? Or any idea? 🙏🙏
Solved! Go to Solution.
- Mark as New
- Bookmark
- Subscribe
- Mute
- Subscribe to RSS Feed
- Permalink
- Report Inappropriate Content
Hi @Roman-Korovets,
It's a hard question to answer without knowing more about your visual. I also don't have any experience with Report Server, but I'll try to provide some overall advice I typically adapt. To the absolute best of my knowledge, Webpack compilation is all done on the client; the only server-side comms are done when you reload the developer visual in the Service (and it will check your local cert for the socket).
In my experience, an increase in compile time is typically due to the effort required to transpile TypeScript to JavaScript, and then do all the necesary packaging of your libraries and dependencies.
To this end, the first things I might consider are: have you added any packages or dependencies recently that weren't there before (or even updated any)? Have you changed or updated the version of powerbi-visuals-tools that you use to package your visual?
Next, I might look at the size of my packaged visual. Unless your codebase is enormous (including any dependencies), it shouldn't be more then 500KB or so. If it is, then it's likely to be your packages that are pushing-up the size. Note that even at this size, a lot of minification and tree-shaking is bringing this down from a much larger size, which has a compute cost, and therefore an impact on the compilation time.
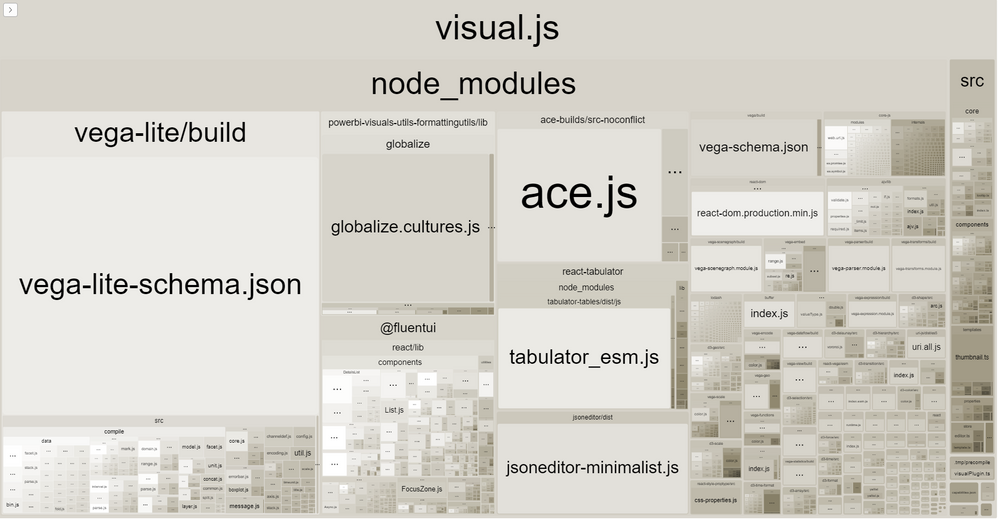
You can check the webpack.statistics*.html files in your project to have a look at the composition of your package (note that you may need to package your visual for these to appear/update). Here's one for Deneb:
- You'll notice that most of my visual's packaged code resides in the node_modules folder, so it's mostly dependencies that are making-up the package.
- My /src folder is over on the right, and this is nearly 1MB, which is pretty big in iself.
- The entire visual's packaged size is about 1.3MB, but it starts out at over 10MB before Webpack does its thing.
This used to take over a minute to compile each time I saved a change, but having upgraded my dev machine recently, this now takes about 5-8 seconds, which is a bit better to work with. I appreciate that this may not always be an easy solution, so the next thing might be to really scrutinise my dependencies and make sure I'm importing them correctly.
I've reviewed each one of the 'big' areas of the treemap to ensure that I only have what I need and what can be done about mitigating them, and occasionally do it every now and again just to be sure nothing new has crept in. One issue I found was that because I use lodash, I was just importing the whole library, whereas only importing the modules I needed was the 'correct' way to do it, and I reduced my packaged visual size by more than 10%, and improved the package time quite significantly also.
Hopefully some of this may help you identify a root cause.
Good luck, and I hope you stay safe and well,
Daniel
Did I answer your question? Mark my post as a solution!
Proud to be a Super User!
On how to ask a technical question, if you really want an answer (courtesy of SQLBI)
- Mark as New
- Bookmark
- Subscribe
- Mute
- Subscribe to RSS Feed
- Permalink
- Report Inappropriate Content
Hi @Roman-Korovets ,
Whether the advice given by @dm-p has solved your confusion, if the problem has been solved you can mark the reply for the standard answer to help the other members find it more quickly. If not, please point it out.
Looking forward to your feedback.
Best Regards,
Henry
- Mark as New
- Bookmark
- Subscribe
- Mute
- Subscribe to RSS Feed
- Permalink
- Report Inappropriate Content
Hi @Roman-Korovets,
It's a hard question to answer without knowing more about your visual. I also don't have any experience with Report Server, but I'll try to provide some overall advice I typically adapt. To the absolute best of my knowledge, Webpack compilation is all done on the client; the only server-side comms are done when you reload the developer visual in the Service (and it will check your local cert for the socket).
In my experience, an increase in compile time is typically due to the effort required to transpile TypeScript to JavaScript, and then do all the necesary packaging of your libraries and dependencies.
To this end, the first things I might consider are: have you added any packages or dependencies recently that weren't there before (or even updated any)? Have you changed or updated the version of powerbi-visuals-tools that you use to package your visual?
Next, I might look at the size of my packaged visual. Unless your codebase is enormous (including any dependencies), it shouldn't be more then 500KB or so. If it is, then it's likely to be your packages that are pushing-up the size. Note that even at this size, a lot of minification and tree-shaking is bringing this down from a much larger size, which has a compute cost, and therefore an impact on the compilation time.
You can check the webpack.statistics*.html files in your project to have a look at the composition of your package (note that you may need to package your visual for these to appear/update). Here's one for Deneb:
- You'll notice that most of my visual's packaged code resides in the node_modules folder, so it's mostly dependencies that are making-up the package.
- My /src folder is over on the right, and this is nearly 1MB, which is pretty big in iself.
- The entire visual's packaged size is about 1.3MB, but it starts out at over 10MB before Webpack does its thing.
This used to take over a minute to compile each time I saved a change, but having upgraded my dev machine recently, this now takes about 5-8 seconds, which is a bit better to work with. I appreciate that this may not always be an easy solution, so the next thing might be to really scrutinise my dependencies and make sure I'm importing them correctly.
I've reviewed each one of the 'big' areas of the treemap to ensure that I only have what I need and what can be done about mitigating them, and occasionally do it every now and again just to be sure nothing new has crept in. One issue I found was that because I use lodash, I was just importing the whole library, whereas only importing the modules I needed was the 'correct' way to do it, and I reduced my packaged visual size by more than 10%, and improved the package time quite significantly also.
Hopefully some of this may help you identify a root cause.
Good luck, and I hope you stay safe and well,
Daniel
Did I answer your question? Mark my post as a solution!
Proud to be a Super User!
On how to ask a technical question, if you really want an answer (courtesy of SQLBI)
- Mark as New
- Bookmark
- Subscribe
- Mute
- Subscribe to RSS Feed
- Permalink
- Report Inappropriate Content
Thank you so much Daniel for the so detailed information 👍😊
I will do investigation about current build.
I stay safe and well, thanks again 🤝
Helpful resources

Fabric Data Days
Advance your Data & AI career with 50 days of live learning, contests, hands-on challenges, study groups & certifications and more!

Power BI Monthly Update - October 2025
Check out the October 2025 Power BI update to learn about new features.

| User | Count |
|---|---|
| 5 | |
| 3 | |
| 2 | |
| 1 | |
| 1 |
| User | Count |
|---|---|
| 10 | |
| 5 | |
| 5 | |
| 5 | |
| 4 |


