FabCon is coming to Atlanta
Join us at FabCon Atlanta from March 16 - 20, 2026, for the ultimate Fabric, Power BI, AI and SQL community-led event. Save $200 with code FABCOMM.
Register now!Go To
- Power BI forums
- Get Help with Power BI
- Desktop
- Service
- Report Server
- Power Query
- Mobile Apps
- Developer
- DAX Commands and Tips
- Custom Visuals Development Discussion
- Health and Life Sciences
- Power BI Spanish forums
- Translated Spanish Desktop
- Training and Consulting
- Instructor Led Training
- Dashboard in a Day for Women, by Women
- Galleries
- Data Stories Gallery
- Themes Gallery
- Contests Gallery
- QuickViz Gallery
- Quick Measures Gallery
- Visual Calculations Gallery
- Notebook Gallery
- Translytical Task Flow Gallery
- TMDL Gallery
- R Script Showcase
- Webinars and Video Gallery
- Ideas
- Custom Visuals Ideas (read-only)
- Issues
- Issues
- Events
- Upcoming Events
Turn on suggestions
Auto-suggest helps you quickly narrow down your search results by suggesting possible matches as you type.
Showing results for
Get Fabric Certified for FREE during Fabric Data Days. Don't miss your chance! Request now
- Power BI forums
- Galleries
- R Script Showcase
- Re: SIMPLE K-CHART (Candlestick)


- Mark as New
- Bookmark
- Subscribe
- Mute
- Subscribe to RSS Feed
- Permalink
- Report Inappropriate Content
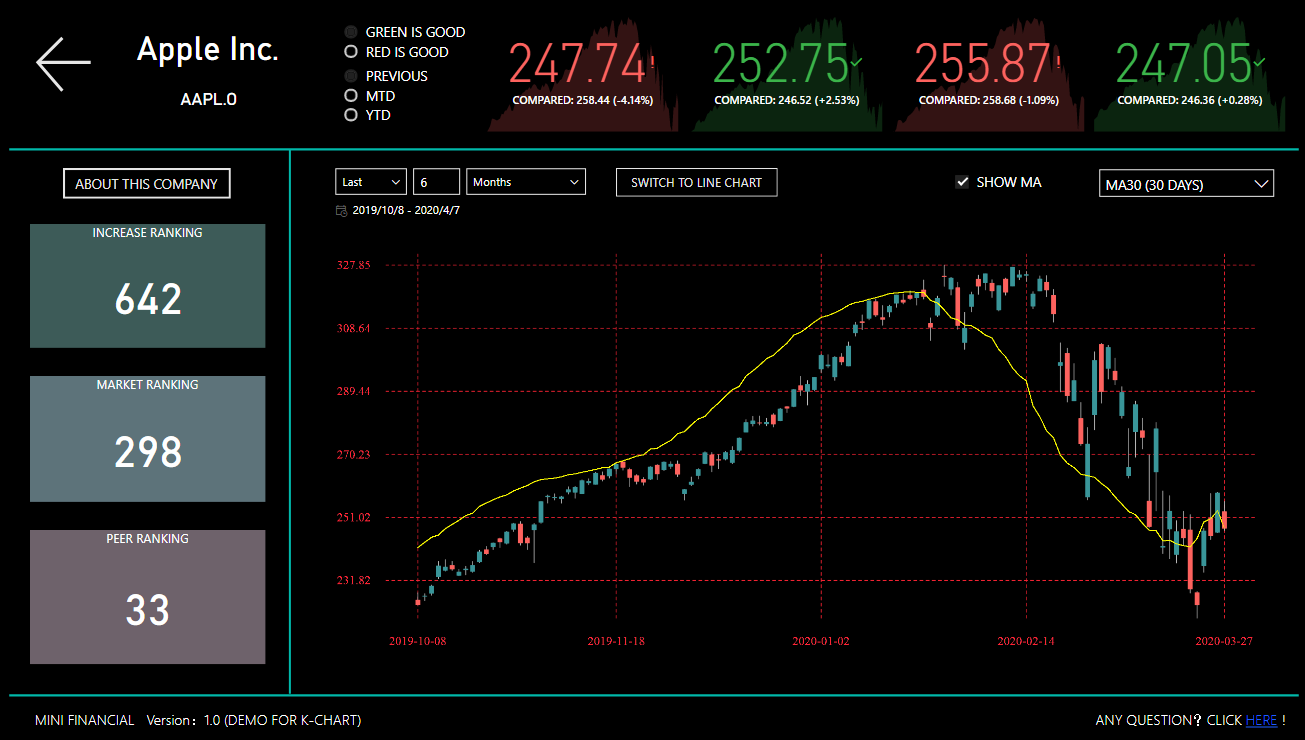
SIMPLE K-CHART (Candlestick)
04-07-2020
09:51 AM

ABOUT
A simple k-chart generated by basic R.
FEATURE
Ability to control R visualization using DAX
(such as switching colors, showing or hiding charts, changing calculation behavior, etc.)

REQUIRED R PACKAGES
None
TEST ON
Power BI Desktop(2.79.5768.721 64-bit ); Power BI Services (Pro License Required)
LEGAL DISCLAIMERS
- Mark as New
- Bookmark
- Subscribe
- Mute
- Subscribe to RSS Feed
- Permalink
- Report Inappropriate Content
10-03-2021
09:20 AM
Hello, really cool project! Would you like to know which data source was used?