FabCon is coming to Atlanta
Join us at FabCon Atlanta from March 16 - 20, 2026, for the ultimate Fabric, Power BI, AI and SQL community-led event. Save $200 with code FABCOMM.
Register now!- Power BI forums
- Get Help with Power BI
- Desktop
- Service
- Report Server
- Power Query
- Mobile Apps
- Developer
- DAX Commands and Tips
- Custom Visuals Development Discussion
- Health and Life Sciences
- Power BI Spanish forums
- Translated Spanish Desktop
- Training and Consulting
- Instructor Led Training
- Dashboard in a Day for Women, by Women
- Galleries
- Data Stories Gallery
- Themes Gallery
- Contests Gallery
- QuickViz Gallery
- Quick Measures Gallery
- Visual Calculations Gallery
- Notebook Gallery
- Translytical Task Flow Gallery
- TMDL Gallery
- R Script Showcase
- Webinars and Video Gallery
- Ideas
- Custom Visuals Ideas (read-only)
- Issues
- Issues
- Events
- Upcoming Events
The Power BI Data Visualization World Championships is back! Get ahead of the game and start preparing now! Learn more
- Power BI forums
- Galleries
- Quick Measures Gallery
- Linear Interpolation
Your file has been submitted successfully. We’re processing it now - please check back in a few minutes to view your report.


- Mark as New
- Bookmark
- Subscribe
- Mute
- Subscribe to RSS Feed
- Permalink
- Report Inappropriate Content
Linear Interpolation
In the mathematical field of numerical analysis, interpolation is a method of constructing new data points within the range of a discrete set of known data points. Anyone that has done mechanical engineering knows all about interpolation. I swear my Thermo and Fluids professor, Dr. Jed Marquart was a sadist, half of our homework and tests was just interpolation.
If I can save just one engineering student time with their homework...
The assumption with linear interpolation is that the two points (x1, y1) and (x2, y2) are connected with a line. Using the two point equation of a line, we get: y - y1 = m (x - x1), where m is the slope and is calculated as m = (y2 - y1)/(x2 - x1) Thus for x3 that is between x1 and x2, we get: y3 = y1 + (x3 - x1) (y2 - y1)/(x2 - x1)
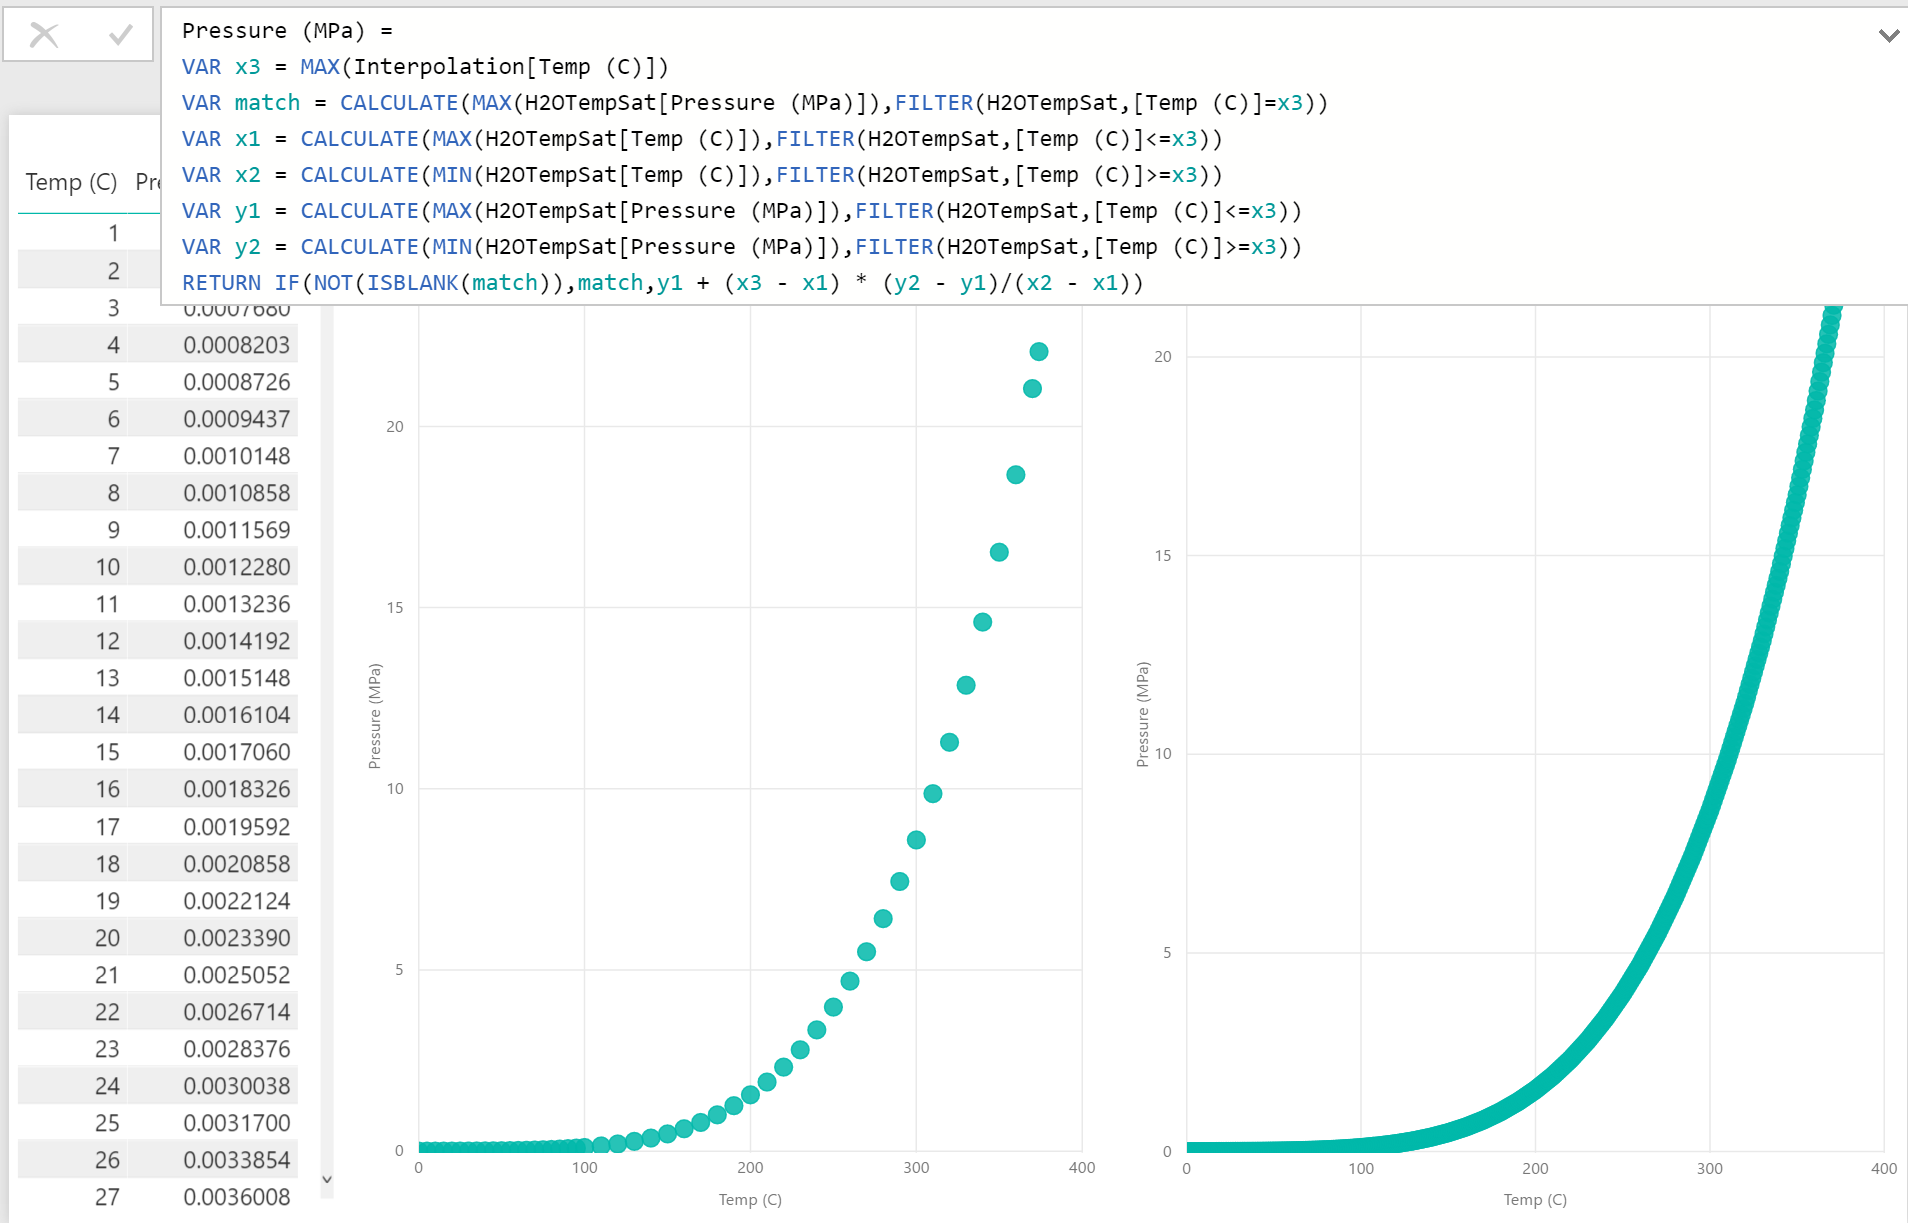
So, this quick measure performs the linear interpolation but also accounts for when linear interpolation does not need to occur (because the values are already in the set of known value). The example attached uses a thermodynamic steam table.
Pressure (MPa) =
VAR x3 = MAX(Interpolation[Temp (C)]) //This is the known value for which you wish to interpolate another value
VAR match = CALCULATE(MAX(H2OTempSat[Pressure (MPa)]),FILTER(H2OTempSat,[Temp (C)]=x3)) //checks if it is a known value
VAR x1 = CALCULATE(MAX(H2OTempSat[Temp (C)]),FILTER(H2OTempSat,[Temp (C)]<=x3)) //low X value
VAR x2 = CALCULATE(MIN(H2OTempSat[Temp (C)]),FILTER(H2OTempSat,[Temp (C)]>=x3)) //high X value
VAR y1 = CALCULATE(MAX(H2OTempSat[Pressure (MPa)]),FILTER(H2OTempSat,[Temp (C)]<=x3)) //low Y value
VAR y2 = CALCULATE(MIN(H2OTempSat[Pressure (MPa)]),FILTER(H2OTempSat,[Temp (C)]>=x3)) //low X value
RETURN IF(NOT(ISBLANK(match)),match,y1 + (x3 - x1) * (y2 - y1)/(x2 - x1)) //if a match, return match otherwise interpolate
The generic version of this is:
Interpolated Value =
VAR x3 = MAX('Table'[Known Value])
VAR match = CALCULATE(MAX('LookupTable'[Sought Value]),FILTER('LookupTable',[Known Value]=x3))
VAR x1 = CALCULATE(MAX('LookupTable'[Known Value]),FILTER('LookupTable',[Known Value]<=x3))
VAR x2 = CALCULATE(MIN('LookupTable'[Known Value]),FILTER('LookupTable',[Known Value]>=x3))
VAR y1 = CALCULATE(MAX('LookupTable'[Sought Value]),FILTER('LookupTable',[Known Value]<=x3))
VAR y2 = CALCULATE(MIN('LookupTable'[Sought Value]),FILTER('LookupTable',[Known Value]>=x3))
RETURN IF(NOT(ISBLANK(match)),match,y1 + (x3 - x1) * (y2 - y1)/(x2 - x1))
Essentially, you have a "known value" that you are working with, like Temperature, and you are looking for a "sought value" like Pressure. The first line (x3) can be a number, measure or a column reference as shown.
eyJrIjoiNjIyY2Y5OTctZTJjNS00NzFmLWE1YzItOWRkZjRhNTA5N2Q1IiwidCI6IjRhMDQyNzQzLTM3M2EtNDNkMi04MjdiLTAwM2Y0YzdiYTFlNSIsImMiOjN9
Follow on LinkedIn
@ me in replies or I'll lose your thread!!!
Instead of a Kudo, please vote for this idea
Become an expert!: Enterprise DNA
External Tools: MSHGQM
YouTube Channel!: Microsoft Hates Greg
Latest book!: DAX For Humans
DAX is easy, CALCULATE makes DAX hard...
- Mark as New
- Bookmark
- Subscribe
- Mute
- Subscribe to RSS Feed
- Permalink
- Report Inappropriate Content
Excellent post! Thank you. What if there were multiple "items" in the same data set to calculate the interpolation for? I guess we need to add another parameter to the FILTER expressions that calculate the VARIABLES for each "item" per the current row, but I couldn't figure out how.