FabCon is coming to Atlanta
Join us at FabCon Atlanta from March 16 - 20, 2026, for the ultimate Fabric, Power BI, AI and SQL community-led event. Save $200 with code FABCOMM.
Register now!- Power BI forums
- Get Help with Power BI
- Desktop
- Service
- Report Server
- Power Query
- Mobile Apps
- Developer
- DAX Commands and Tips
- Custom Visuals Development Discussion
- Health and Life Sciences
- Power BI Spanish forums
- Translated Spanish Desktop
- Training and Consulting
- Instructor Led Training
- Dashboard in a Day for Women, by Women
- Galleries
- Data Stories Gallery
- Themes Gallery
- Contests Gallery
- QuickViz Gallery
- Quick Measures Gallery
- Visual Calculations Gallery
- Notebook Gallery
- Translytical Task Flow Gallery
- TMDL Gallery
- R Script Showcase
- Webinars and Video Gallery
- Ideas
- Custom Visuals Ideas (read-only)
- Issues
- Issues
- Events
- Upcoming Events
The Power BI Data Visualization World Championships is back! Get ahead of the game and start preparing now! Learn more
- Power BI forums
- Galleries
- Quick Measures Gallery
- Re: Dynamic Measures/Titles (Using SWITCH)
Your file has been submitted successfully. We’re processing it now - please check back in a few minutes to view your report.


- Mark as New
- Bookmark
- Subscribe
- Mute
- Subscribe to RSS Feed
- Permalink
- Report Inappropriate Content
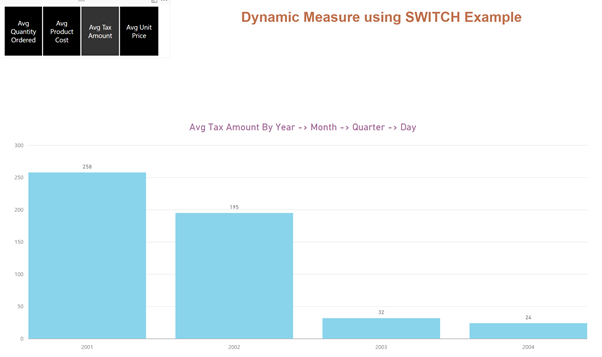
Dynamic Measures/Titles (Using SWITCH)
This Quick Measure allows you to display a different measure in the chart depending on the selection in a slicer.
In the attached example, there are 4 possible measures which can be chosen: (i) Avg Quantity Ordered, (ii) Avg Product Cost, (iii) Avg Tax Amount and (iv) Avg Unit price.
These measure names are defined in a single-column paramter table (manually entered or could be created automatically by the Quick Measures wizard). This column/table is used as the slicer selection and the measure shown in the bar chart is then calculated as:
SelectedMeasure = IF(HASONEVALUE(tblParamMeasures[MeasureName]),SWITCH(VALUES(tblParamMeasures[MeasureName]),"Avg Unit Price",AVERAGE(fctSales[UnitPrice]),"Avg Quantity Ordered",AVERAGE(fctSales[OrderQuantity]),"Avg Tax Amount",AVERAGE(fctSales[TaxAmt]),"Avg Product Cost",AVERAGE(fctSales[ProductStandardCost])),AVERAGE(fctSales[UnitPrice]))
This expression needs a default option in the event that a single measure name has not been selected and in this case this is the Average Unit Price.
It is important for the chart to also have a dynamic title so that it is clear what is being displayed. The DAX expression for this could be something like:
Measure Title = IF(HASONEVALUE(tblParamMeasures[MeasureName]),VALUES(tblParamMeasures[MeasureName]),"Avg Unit Price") & " By Year -> Month -> Quarter -> Day"
It is important to ensure the same default option (in this case Avg Unit Price) is used.
eyJrIjoiY2I1NjJmYjQtNWIzNy00NTFkLTg3N2UtMTM4YmFmNjA2MDA3IiwidCI6IjBjNzk5ZDM4LTQ3NjQtNDJiYy1iNGZmLTIzYmViYTljN2ZlMiIsImMiOjh9
- Mark as New
- Bookmark
- Subscribe
- Mute
- Subscribe to RSS Feed
- Permalink
- Report Inappropriate Content
Hi,
Thanks for shairing this - it's great.
However I wonder if this is possible to use in LiveQuery mode where I can't create separate table for measure.
Do you have any workaround, suggested approach for this?
Cheers!
- Mark as New
- Bookmark
- Subscribe
- Mute
- Subscribe to RSS Feed
- Permalink
- Report Inappropriate Content
This is just what I've been looking for.
It's a shame that theres no expression capability for titles on visuals.
- Mark as New
- Bookmark
- Subscribe
- Mute
- Subscribe to RSS Feed
- Permalink
- Report Inappropriate Content
Thank you! This is very useful - I've been searching for an example like this!