FabCon is coming to Atlanta
Join us at FabCon Atlanta from March 16 - 20, 2026, for the ultimate Fabric, Power BI, AI and SQL community-led event. Save $200 with code FABCOMM.
Register now!- Power BI forums
- Get Help with Power BI
- Desktop
- Service
- Report Server
- Power Query
- Mobile Apps
- Developer
- DAX Commands and Tips
- Custom Visuals Development Discussion
- Health and Life Sciences
- Power BI Spanish forums
- Translated Spanish Desktop
- Training and Consulting
- Instructor Led Training
- Dashboard in a Day for Women, by Women
- Galleries
- Data Stories Gallery
- Themes Gallery
- Contests Gallery
- QuickViz Gallery
- Quick Measures Gallery
- Visual Calculations Gallery
- Notebook Gallery
- Translytical Task Flow Gallery
- TMDL Gallery
- R Script Showcase
- Webinars and Video Gallery
- Ideas
- Custom Visuals Ideas (read-only)
- Issues
- Issues
- Events
- Upcoming Events
Get Fabric Certified for FREE during Fabric Data Days. Don't miss your chance! Request now
- Power BI forums
- Forums
- Get Help with Power BI
- Power Query
- Group by day and hour, and get max value from anot...
- Subscribe to RSS Feed
- Mark Topic as New
- Mark Topic as Read
- Float this Topic for Current User
- Bookmark
- Subscribe
- Printer Friendly Page

- Mark as New
- Bookmark
- Subscribe
- Mute
- Subscribe to RSS Feed
- Permalink
- Report Inappropriate Content
Group by day and hour, and get max value from another column
Hi, I need to group or get a measure with the datetime and time columns from next sample.
| id | datetime | time |
| 1 | 28/03/2023 09:30:03 pm | 205 |
| 2 | 28/03/2023 09:28:50 pm | |
| 3 | 28/03/2023 09:25:10 pm | 198 |
| 4 | 28/03/2023 09:20:34 pm | |
| 5 | 28/03/2023 09:11:40 pm | 123 |
| 6 | 28/03/2023 09:04:50 pm | |
| 7 | 28/03/2023 08:46:23 pm | 112 |
| 8 | 28/03/2023 08:33:55 pm | 95 |
| 9 | 28/03/2023 08:18:36 pm | |
| 10 | 28/03/2023 07:48:48 pm | |
| 11 | 28/03/2023 07:28:18 pm | 90 |
The idea is that I need to group by day and hour in 'datetime' column, and get the max value from the 'time' colum, for example for day 28/03 at 9-10pm, i'd need to get the 205, then for 28/03 8-9pm get the 112 value and so. This would also apply when I found the 27/03 day. The idea is to find the max value within the range of 1 hour each hour in a day.
The objective is to get something like this:
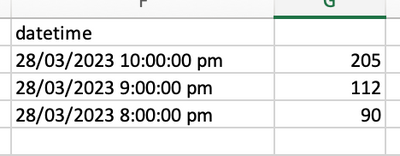
To be abel to create a bar chart, each bar representing 1 hour, where I can see what is that maximum value in that hour.
I'd really aprecciate all your support.
Solved! Go to Solution.


- Mark as New
- Bookmark
- Subscribe
- Mute
- Subscribe to RSS Feed
- Permalink
- Report Inappropriate Content
@hekutoru Must have gotten here when it was still an image. See attached PBIX below signature. You create a disconnected table like this:
Dates and Hours =
    SELECTCOLUMNS(
        ADDCOLUMNS(
            GENERATE(
                CALENDAR(MIN('Table'[datetime]), MAX('Table'[datetime])),
                GENERATESERIES(0,23)
            ),
            "datetime", [Date] + [Value]/24
        ),
        "datetime",[datetime]
    )
and then a measure like this:
Measure =
  VAR __dateTime = MAX('Dates and Hours'[datetime])
  VAR __date = DATE(YEAR(__dateTime), MONTH(__dateTime), DAY(__dateTime))
  VAR __hour = HOUR(__dateTime)
  VAR __table = FILTER(ALL('Table'), DATE(YEAR(__dateTime), MONTH(__dateTime), DAY(__dateTime)) = __date && HOUR('Table'[dateTime]) + 1 = __hour)
  VAR __result = MAXX(__table, [time])
RETURN
  __result
Follow on LinkedIn
@ me in replies or I'll lose your thread!!!
Instead of a Kudo, please vote for this idea
Become an expert!: Enterprise DNA
External Tools: MSHGQM
YouTube Channel!: Microsoft Hates Greg
Latest book!: DAX For Humans
DAX is easy, CALCULATE makes DAX hard...


- Mark as New
- Bookmark
- Subscribe
- Mute
- Subscribe to RSS Feed
- Permalink
- Report Inappropriate Content
For peak calculations, have a look in this video as well, very good approach using calculated tables:

- Mark as New
- Bookmark
- Subscribe
- Mute
- Subscribe to RSS Feed
- Permalink
- Report Inappropriate Content
You can add two custom columns, DateTime.Date and Time.Hour, then group by date and hour, and use the Max aggregation for your "time" column.
--Nate
- Mark as New
- Bookmark
- Subscribe
- Mute
- Subscribe to RSS Feed
- Permalink
- Report Inappropriate Content
@hekutoru Didn't post the sample data as text so having to wing it. Maybe:
Measure =
  VAR __dateTime = MAX('Table'[datetime])
  VAR __date = DATE(__dateTime)
  VAR __hour = HOUR(__dateTime)
  VAR __table = FILTER(ALL('Table'), DATE('Table'[datetime]) = __date && HOUR('Table'[dateTime]) = __hour)
  VAR __result = MAXX(__table, [time])
RETURN
  __result
Follow on LinkedIn
@ me in replies or I'll lose your thread!!!
Instead of a Kudo, please vote for this idea
Become an expert!: Enterprise DNA
External Tools: MSHGQM
YouTube Channel!: Microsoft Hates Greg
Latest book!: DAX For Humans
DAX is easy, CALCULATE makes DAX hard...
- Mark as New
- Bookmark
- Subscribe
- Mute
- Subscribe to RSS Feed
- Permalink
- Report Inappropriate Content
- Mark as New
- Bookmark
- Subscribe
- Mute
- Subscribe to RSS Feed
- Permalink
- Report Inappropriate Content
@hekutoru Must have gotten here when it was still an image. See attached PBIX below signature. You create a disconnected table like this:
Dates and Hours =
    SELECTCOLUMNS(
        ADDCOLUMNS(
            GENERATE(
                CALENDAR(MIN('Table'[datetime]), MAX('Table'[datetime])),
                GENERATESERIES(0,23)
            ),
            "datetime", [Date] + [Value]/24
        ),
        "datetime",[datetime]
    )
and then a measure like this:
Measure =
  VAR __dateTime = MAX('Dates and Hours'[datetime])
  VAR __date = DATE(YEAR(__dateTime), MONTH(__dateTime), DAY(__dateTime))
  VAR __hour = HOUR(__dateTime)
  VAR __table = FILTER(ALL('Table'), DATE(YEAR(__dateTime), MONTH(__dateTime), DAY(__dateTime)) = __date && HOUR('Table'[dateTime]) + 1 = __hour)
  VAR __result = MAXX(__table, [time])
RETURN
  __result
Follow on LinkedIn
@ me in replies or I'll lose your thread!!!
Instead of a Kudo, please vote for this idea
Become an expert!: Enterprise DNA
External Tools: MSHGQM
YouTube Channel!: Microsoft Hates Greg
Latest book!: DAX For Humans
DAX is easy, CALCULATE makes DAX hard...
- Mark as New
- Bookmark
- Subscribe
- Mute
- Subscribe to RSS Feed
- Permalink
- Report Inappropriate Content
@Greg_Deckler thank you very much.
almost working. The problem is that when I have more than one day the value is being duplicated for every hour
For example, the same value for 28/03/2023 9:00:00 pm is being duplicated for 27/03/2023 9:00:00 pm, even if I don't have values for that 27/03 day and time
- Mark as New
- Bookmark
- Subscribe
- Mute
- Subscribe to RSS Feed
- Permalink
- Report Inappropriate Content
thank you, I've already post as text, add some information too
Helpful resources

Power BI Monthly Update - November 2025
Check out the November 2025 Power BI update to learn about new features.

Fabric Data Days
Advance your Data & AI career with 50 days of live learning, contests, hands-on challenges, study groups & certifications and more!

FabCon Atlanta 2026
Join us at FabCon Atlanta, March 16-20, for the ultimate Fabric, Power BI, AI and SQL community-led event. Save $200 with code FABCOMM.

| User | Count |
|---|---|
| 10 | |
| 9 | |
| 6 | |
| 5 | |
| 3 |


