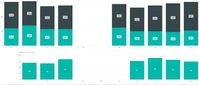
I am trying to create a chart that would show changes in service tickets.
I do have a dataset that shows me the ticket numbers for each day, i.e.
Ticket 10001000 | 2019-10-01
Ticket 10001001 | 2019-10-01
Ticket 10001002 | 2019-10-01
Ticket 10001000 | 2019-10-02
Ticket 10001001 | 2019-10-02
Ticket 10001003 | 2019-10-02
What I would like my chart to show not only the sum of distinct ticket numbers per day, but also, that on 2019-10-02, there was one ticket closed and one new ticket opened...
Would there be a way to show the inflow / outflow of tickets in a chart?
I think what I would need to do is to create some sort of comparison between (current_date) and ((current_date) - 1) where I would be comparing the distinct ticket numbers and highlight the differences. I know how I could do this in Excel, but I certainly wouldn't want to get back on that train... Any help would be appreciated!
count = CALCULATE(DISTINCTCOUNT('Table'[Ticket I
D]),ALLEXCEPT('Table','Table'[Date]))
difference =
VAR d =
    MAX ( 'Table'[Date] ) - 1
VAR c =
    CALCULATE (
        DISTINCTCOUNT ( 'Table'[Ticket ID] ),
        ALLEXCEPT ( 'Table', 'Table'[Date] )
    )
VAR a =
    CALCULATE (
        DISTINCTCOUNT ( 'Table'[Ticket ID] ),
        FILTER ( ALL ( 'Table' ), 'Table'[Date] = d )
    )
RETURN
    IF ( a = BLANK (), BLANK (), c - a )
Community Support Team _ Frank If this post helps, then please consider Accept it as the solution to help the others find it more quickly.