Join us at FabCon Vienna from September 15-18, 2025
The ultimate Fabric, Power BI, SQL, and AI community-led learning event. Save €200 with code FABCOMM.
Get registered- Power BI forums
- Get Help with Power BI
- Desktop
- Service
- Report Server
- Power Query
- Mobile Apps
- Developer
- DAX Commands and Tips
- Custom Visuals Development Discussion
- Health and Life Sciences
- Power BI Spanish forums
- Translated Spanish Desktop
- Training and Consulting
- Instructor Led Training
- Dashboard in a Day for Women, by Women
- Galleries
- Data Stories Gallery
- Themes Gallery
- Contests Gallery
- Quick Measures Gallery
- Notebook Gallery
- Translytical Task Flow Gallery
- TMDL Gallery
- R Script Showcase
- Webinars and Video Gallery
- Ideas
- Custom Visuals Ideas (read-only)
- Issues
- Issues
- Events
- Upcoming Events
Compete to become Power BI Data Viz World Champion! First round ends August 18th. Get started.
- Power BI forums
- Forums
- Get Help with Power BI
- Developer
- Zero value showing something different in graph
- Subscribe to RSS Feed
- Mark Topic as New
- Mark Topic as Read
- Float this Topic for Current User
- Bookmark
- Subscribe
- Printer Friendly Page
- Mark as New
- Bookmark
- Subscribe
- Mute
- Subscribe to RSS Feed
- Permalink
- Report Inappropriate Content
Zero value showing something different in graph
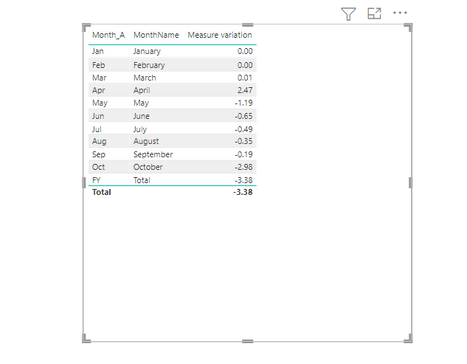
i have graph Month wise . in my graph Month of feb . have zero value . its showing zero table format when i change to table to clusterd column showing like -4.39E-5 .like below graph
My power bi Graph in clusted chart
In table view :
How to fix this issues ?
Same Data in table view :
Solved! Go to Solution.
- Mark as New
- Bookmark
- Subscribe
- Mute
- Subscribe to RSS Feed
- Permalink
- Report Inappropriate Content
-4.39e-5 is a scientific notation to handle either very large or very small numbers.
Please change the data type to Decimal, and set decimal places to 2
- Mark as New
- Bookmark
- Subscribe
- Mute
- Subscribe to RSS Feed
- Permalink
- Report Inappropriate Content
-4.39e-5 is a scientific notation to handle either very large or very small numbers.
Please change the data type to Decimal, and set decimal places to 2
Helpful resources
| User | Count |
|---|---|
| 5 | |
| 3 | |
| 2 | |
| 2 | |
| 2 |
| User | Count |
|---|---|
| 11 | |
| 7 | |
| 5 | |
| 4 | |
| 4 |


