cancel
Showing results for 
Search instead for 
Did you mean: 

July 28 - August 9 | Final Round of the Power BI Dataviz World Championships. This is your chance. Learn more

Reply
StreamingD
New Member

Streaming Data - Time Problems - Python / Bash

I use Power Bi to visualize Streaming Data and I kinda like it, because of the UI design and how easy it is to configure. But unfortunately I really struggle with displaying the right time in graphs. I recognized the following problems:
-Displayed time is one hour to early, althoug the sent time is correct, I live in GMT+1 timezone, this happens for python and bash scripts
-If a use a python or bash script to update the time, the graph is never filled out completely, just the few hours / mins on the right side

I really like Power BI, but with this issues, it's almost unusable...

How can I fix the mentioned problems?

When will it be possible to display a text in a card box?
5 REPLIES 5
StreamingD
New Member

I use Power Bi to visualize Streaming Data and I kinda like it, because of the UI design and how easy it is to configure. But unfortunately I really struggle with displaying the right time in graphs. I recognized the following problems:
-Displayed time is one hour to early, althoug the sent time is correct, I live in GMT+1 timezone, this happens for python and bash scripts
-If a use a python or bash script to update the time, the graph is never filled out completely, just the few hours / mins on the right side

I really like Power BI, but with this issues, it's almost unusable...

How can I fix the mentioned problems?


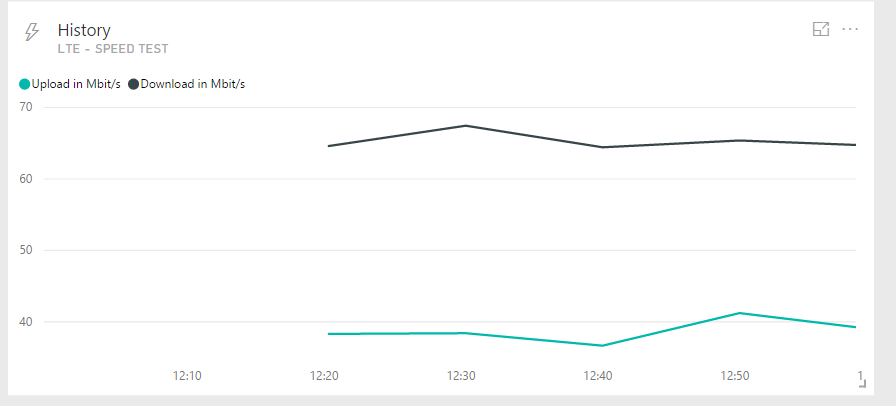
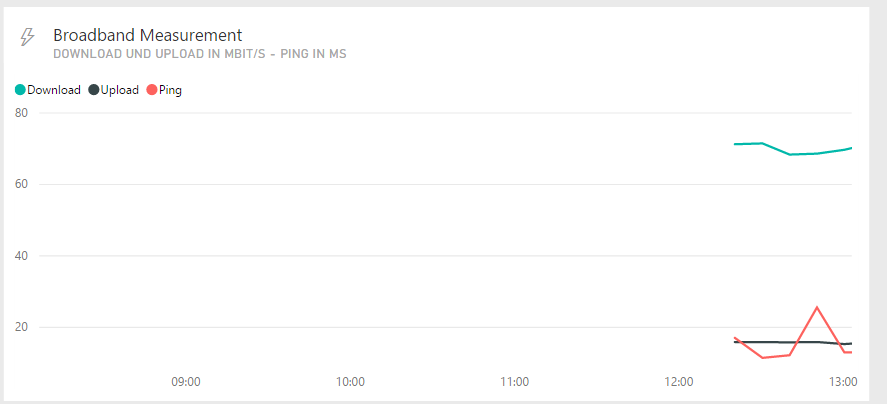
Speedtest.PNGspeedtest2.PNG

@StreamingD

Do you have that problem only when using Python? If so, may you post the python code? I doubt it is the datetime format in the sent JSON, an ISO 8601 format 2017-03-09T00:53:42Z shall work.

I double checked the issue with the report function, the time is corect there if I use a bash script to stream the data. So it's probably a bug of the dashboard streaming data function. However, with the python script I can not even display data in the report function! It's really bad that such functions are not working correctly. 

@StreamingD

Have you tried to delete and re-create a new streaming dataset? Could you post the Python script so that I can try to reproduce this issue?

It's really strange, since a few days the time is displayed correctly in the dashboard, but if I refreshed the the page, just one hour is displayed on the right corner. 


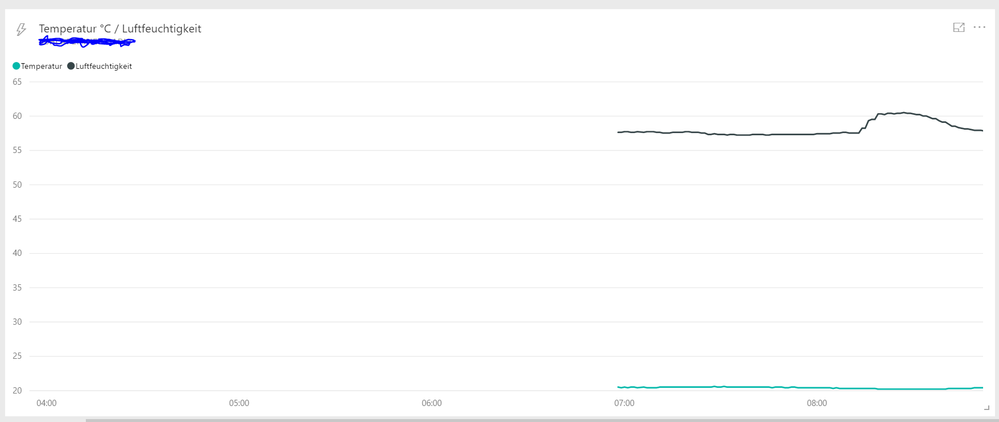
Thats the way how it looks after having the dashboard page open for 2 hours without a refresh:

dashboard_ok.PNG


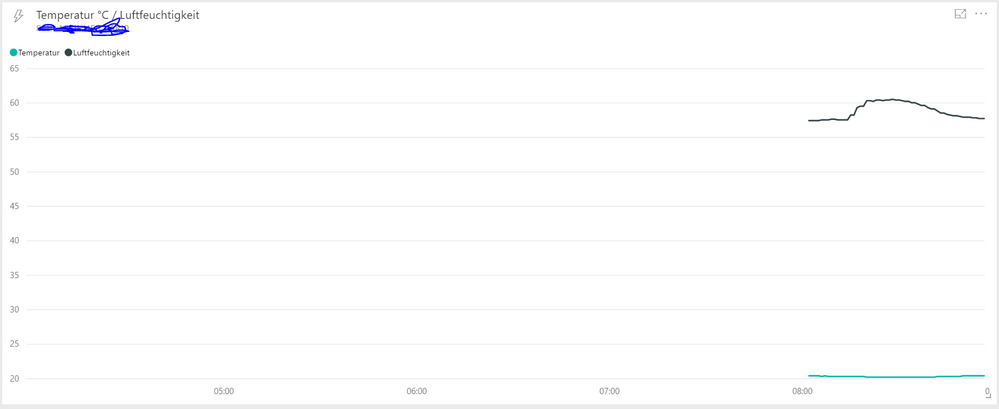
That's the way how it looks after a refresh:

dashboard_not_ok.PNG


I can post the script later

Helpful resources

Announcements
FabCon and SQLCon Barcelona 2026

FabCon & SQLCon – Barcelona 2026

Join us in Barcelona for FabCon and SQLCon, the Fabric, Power BI, SQL, and AI community event. Save €200 with code FABCMTY200.

Fabric Community Sticker Design Challenge Barcelona Carousel

Fabric Community Sticker Challenge - Barcelona 2026

If you love stickers, then you will definitely want to check out our community sticker challenge, Barcelona edition!

July Power BI Update Carousel

Power BI Monthly Update - July 2026

Check out the July 2026 Power BI update to learn about new features.

Power BI DataViz World Championships carousel

Power BI DataViz World Championships - June 2026

A new Power BI DataViz World Championship is coming this June! Don't miss out on submitting your entry.