FabCon is coming to Atlanta
Join us at FabCon Atlanta from March 16 - 20, 2026, for the ultimate Fabric, Power BI, AI and SQL community-led event. Save $200 with code FABCOMM.
Register now!- Power BI forums
- Get Help with Power BI
- Desktop
- Service
- Report Server
- Power Query
- Mobile Apps
- Developer
- DAX Commands and Tips
- Custom Visuals Development Discussion
- Health and Life Sciences
- Power BI Spanish forums
- Translated Spanish Desktop
- Training and Consulting
- Instructor Led Training
- Dashboard in a Day for Women, by Women
- Galleries
- Data Stories Gallery
- Themes Gallery
- Contests Gallery
- QuickViz Gallery
- Quick Measures Gallery
- Visual Calculations Gallery
- Notebook Gallery
- Translytical Task Flow Gallery
- TMDL Gallery
- R Script Showcase
- Webinars and Video Gallery
- Ideas
- Custom Visuals Ideas (read-only)
- Issues
- Issues
- Events
- Upcoming Events
The Power BI Data Visualization World Championships is back! It's time to submit your entry. Live now!
- Power BI forums
- Forums
- Get Help with Power BI
- Developer
- Re: Read unstructured data - Excel calendar format
- Subscribe to RSS Feed
- Mark Topic as New
- Mark Topic as Read
- Float this Topic for Current User
- Bookmark
- Subscribe
- Printer Friendly Page
- Mark as New
- Bookmark
- Subscribe
- Mute
- Subscribe to RSS Feed
- Permalink
- Report Inappropriate Content
Read unstructured data - Excel calendar format
Hello,
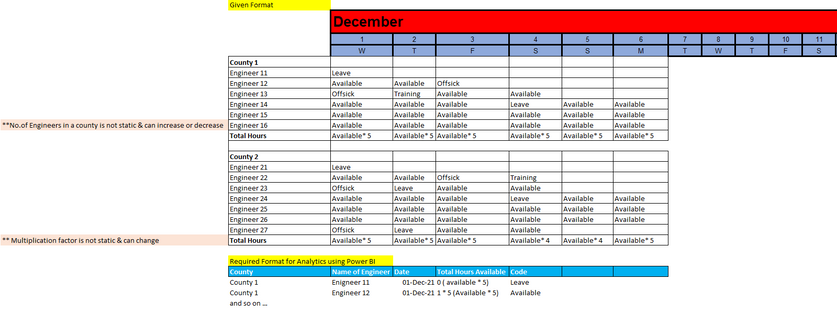
We have a requirement where business feeds Engineer availability data into excel on a daily basis in a calendar format as shown below. We are to convert it into the denormalised format as stated below which can then be used for analytics using Power BI.
Any lead on how we can achieve this format change which is not static & is maintained in different sheets of excel for different months would be of great help!
Thanks!
Solved! Go to Solution.
- Mark as New
- Bookmark
- Subscribe
- Mute
- Subscribe to RSS Feed
- Permalink
- Report Inappropriate Content
Hi @Anonymous ,
You can refer to the following link to process your unstructured data in Power Query.
Best way to structure Excel survey data for leveraging in Power BI?
Power BI - Transferring less structured data
Data Inconsistency excel files different structure - build a model
If possible, try to process it on the data source side first. For example, like the example in your screenshot, you can combine the data of December, day and weekday into one row as a date column just as below screenshot.

Then do the data transformation in Power Query to get the desired result. I have created a sample file(see attachment), please check if it is the result you want.

Best Regards
- Mark as New
- Bookmark
- Subscribe
- Mute
- Subscribe to RSS Feed
- Permalink
- Report Inappropriate Content
Hi @Anonymous ,
Whether your problem has been resolved? If yes, could you please mark the helpful post as Answered? It will help the others in the community find the solution easily if they face the same problem with you. Thank you.
Best Regards
- Mark as New
- Bookmark
- Subscribe
- Mute
- Subscribe to RSS Feed
- Permalink
- Report Inappropriate Content
Hi @Anonymous ,
You can refer to the following link to process your unstructured data in Power Query.
Best way to structure Excel survey data for leveraging in Power BI?
Power BI - Transferring less structured data
Data Inconsistency excel files different structure - build a model
If possible, try to process it on the data source side first. For example, like the example in your screenshot, you can combine the data of December, day and weekday into one row as a date column just as below screenshot.

Then do the data transformation in Power Query to get the desired result. I have created a sample file(see attachment), please check if it is the result you want.

Best Regards
- Mark as New
- Bookmark
- Subscribe
- Mute
- Subscribe to RSS Feed
- Permalink
- Report Inappropriate Content
Please provide sanitized sample data that fully covers your issue. Paste the data into a table in your post or use one of the file services. Please show the expected outcome.
Helpful resources

Power BI Dataviz World Championships
The Power BI Data Visualization World Championships is back! It's time to submit your entry.

Power BI Monthly Update - January 2026
Check out the January 2026 Power BI update to learn about new features.

| User | Count |
|---|---|
| 3 | |
| 3 | |
| 2 | |
| 1 | |
| 1 |
| User | Count |
|---|---|
| 6 | |
| 4 | |
| 3 | |
| 3 | |
| 2 |

