FabCon is coming to Atlanta
Join us at FabCon Atlanta from March 16 - 20, 2026, for the ultimate Fabric, Power BI, AI and SQL community-led event. Save $200 with code FABCOMM.
Register now!- Power BI forums
- Get Help with Power BI
- Desktop
- Service
- Report Server
- Power Query
- Mobile Apps
- Developer
- DAX Commands and Tips
- Custom Visuals Development Discussion
- Health and Life Sciences
- Power BI Spanish forums
- Translated Spanish Desktop
- Training and Consulting
- Instructor Led Training
- Dashboard in a Day for Women, by Women
- Galleries
- Data Stories Gallery
- Themes Gallery
- Contests Gallery
- QuickViz Gallery
- Quick Measures Gallery
- Visual Calculations Gallery
- Notebook Gallery
- Translytical Task Flow Gallery
- TMDL Gallery
- R Script Showcase
- Webinars and Video Gallery
- Ideas
- Custom Visuals Ideas (read-only)
- Issues
- Issues
- Events
- Upcoming Events
Vote for your favorite vizzies from the Power BI Dataviz World Championship submissions. Vote now!
- Power BI forums
- Forums
- Get Help with Power BI
- Developer
- Python visuals strange sporadic behavior
- Subscribe to RSS Feed
- Mark Topic as New
- Mark Topic as Read
- Float this Topic for Current User
- Bookmark
- Subscribe
- Printer Friendly Page
- Mark as New
- Bookmark
- Subscribe
- Mute
- Subscribe to RSS Feed
- Permalink
- Report Inappropriate Content
Python visuals strange sporadic behavior
Hi,
I have a question regarding Python visuals integration in Power BI.
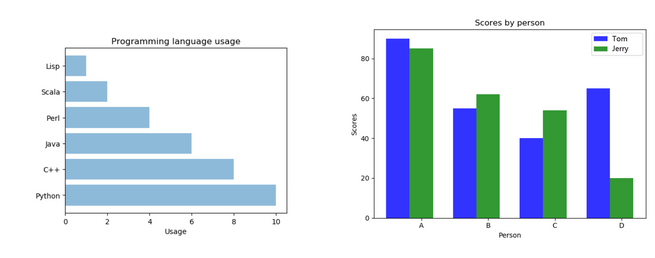
I wanted to test Python visuals behavior and performance in Power BI Embedded so I decided to first create a very simple sample to start with using matplotlib.pyplot and test what I could come up with. Nothing too fancy as shown below.
I then published the new Power BI Desktop report on a testing Workspace I had previously created on Power BI Online
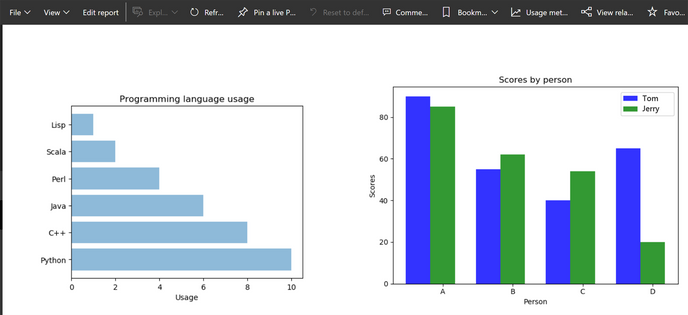
So far so good... Both Python visuals appeared on report sreen exactly as expected.
I then pushed testing a bit furtherusty and created a new dashboard on which I could integrate both Python visuals
in combination with a "native" Column Chart visuals and see what I could come up with...
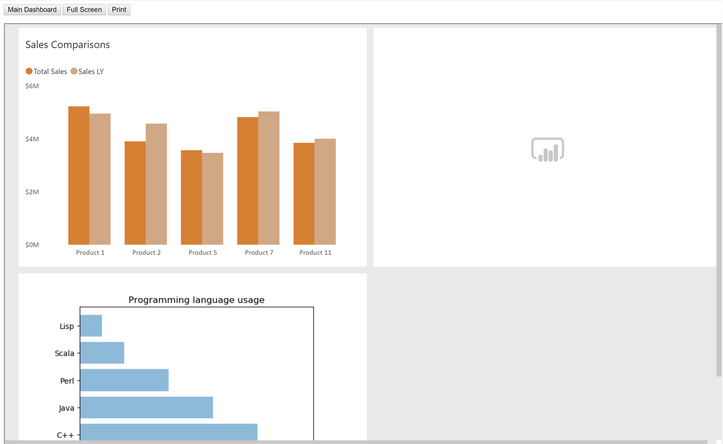
The Python visuals would appear for a second in a glimpse...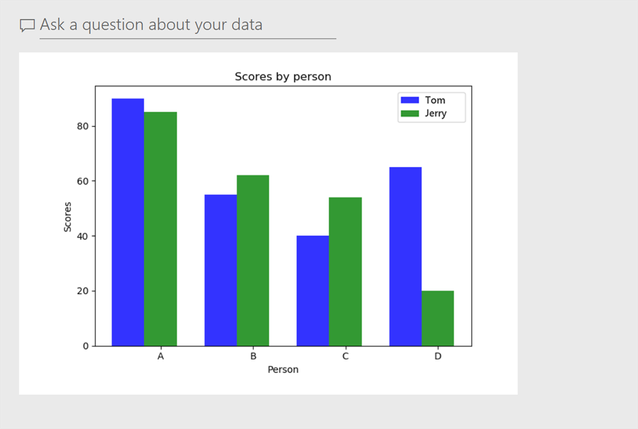
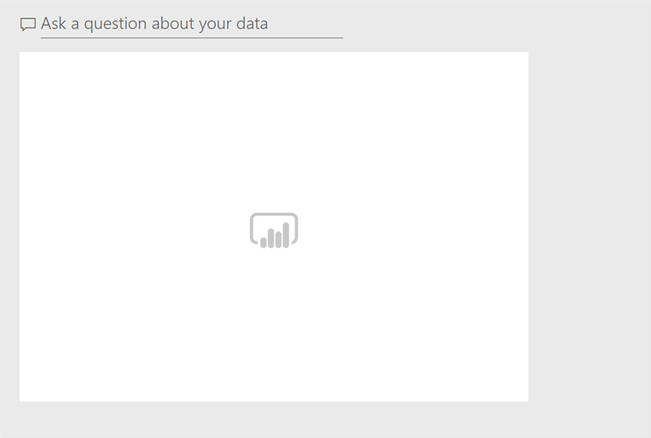
but it soon totally vanished from screen and was replaced by blank content and only a Power BI logo...
Now if I try to run the newly created dashboard in Power BI Embedded, the "native" Column Chart visual tile is displayed on top left, though none of the Python visual tiles are displayed. Only Power BI logos .
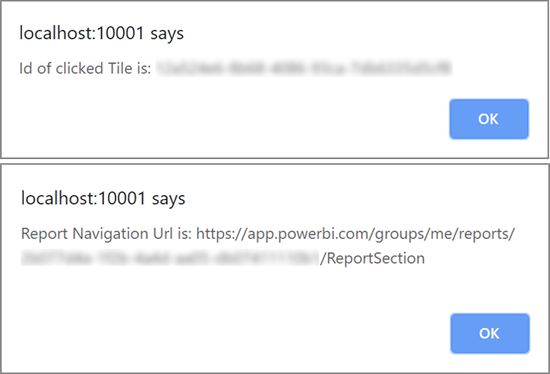
For the sake of testing, I added a piece of client code sending captured information in similar alert popups
in response to dashboard tileClicked event.
This action redirects straight to right report... So I assume both Python visual tiles are there allright!
Now if I click back on "Main Dashboard" navigation button on top left toolbar, the action will bring me back to main dashboard...
Well what do you know!!!? there you are... 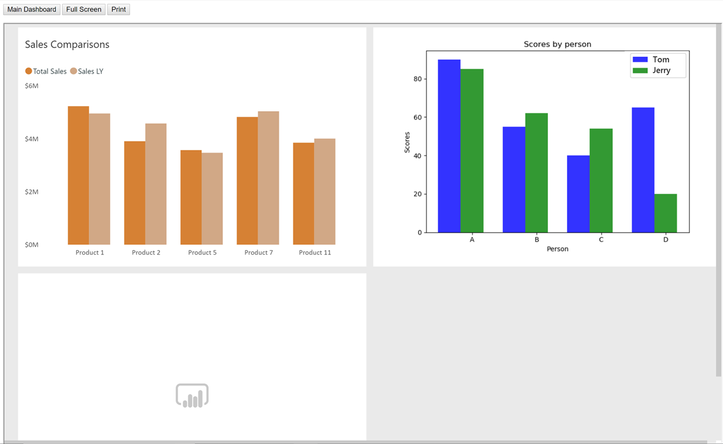
I may repeat the same actions a second time... but this time, I would end up with another display result as shown below...
Hummmm... Bizarre! I understand the Python visuals option is still in Beta version, still I'm pretty curious what may cause this kind of sporadic behavior...
Any help on how to deal with this (from someone who experienced the same kind of scenario) would be greatly appreciated.
Thank you for your patience 😉
Helpful resources

Power BI Dataviz World Championships
Vote for your favorite vizzies from the Power BI World Championship submissions!

Join our Community Sticker Challenge 2026
If you love stickers, then you will definitely want to check out our Community Sticker Challenge!

Power BI Monthly Update - January 2026
Check out the January 2026 Power BI update to learn about new features.

| User | Count |
|---|---|
| 3 | |
| 2 | |
| 1 | |
| 1 | |
| 1 |
| User | Count |
|---|---|
| 4 | |
| 3 | |
| 3 | |
| 2 | |
| 2 |
