Get certified for free when you join Fabric Data Days 2026 and dive into Fabric, Power BI, SQL, AI, and other essential data skills.
Join nowJuly 7 - July 17 | Round 2 of the Power BI Dataviz World Championships. Don't miss your chance! Learn more
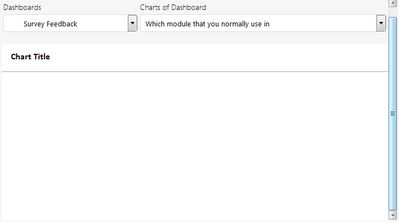
Hi everyone, I created an web application to display all dashboards and tiles from Power BI Site and I used IFrame to display the tiles. But sometimes it just displays the title and sub title, the chart cannot be displayed (as below image). This issue happens intermittently. Can anyone give me suggestion for this issue ? Thanks in advance.
Sorry for the trouble that this issue is causing. We are actively working on a fix.
The fix for this issue should be available in production. Please let us know if you're still seeing it so we can investigate it.
Join us in Barcelona for FabCon and SQLCon, the Fabric, Power BI, SQL, and AI community event. Save €200 with code FABCMTY200.
Join Data Days 2026: 60 days of free live/on-demand sessions, challenges, study groups, and certification opportunities.
| User | Count |
|---|---|
| 3 | |
| 2 | |
| 1 | |
| 1 | |
| 1 |
| User | Count |
|---|---|
| 4 | |
| 4 | |
| 3 | |
| 2 | |
| 2 |