So I have some source data which documents "Staff Travel"
The format is fairly basic (this has been simplified for the purposes of this post):
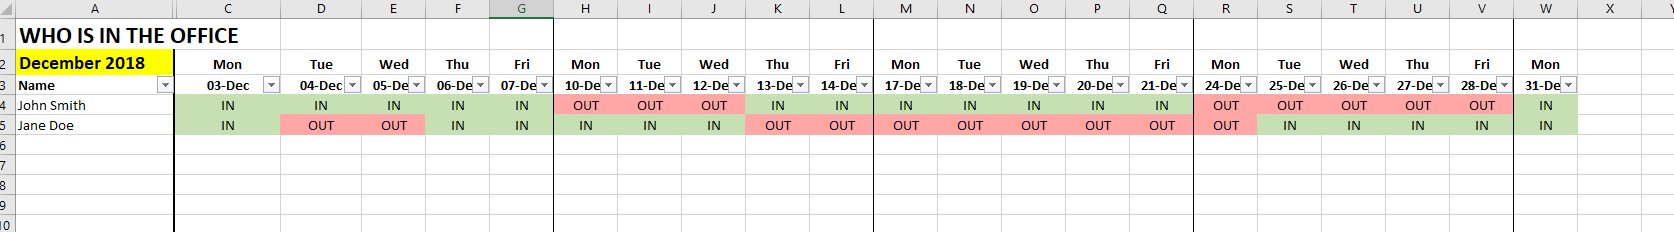
And they want to be able to display this in a Matrix showing who is either "IN" or "OUT" of the office on each day of each month.
I managed to do this in Microsoft Excel fairly quickly using a combination of WEEKDAY and COUNTIFS formulas (it even automatically generates the full matrix each month, only shows Mon-Fri, auto-calculates the first week-day of the month and formats them with separators per week).
*However* .. the client has now asked us to build this natively in Power BI - partly for distribution but mainly so that the delivery, style and design of the reportd ties in with their other Power BI based stuff.
So .. my question to your good selves.
Is this actually possible? (without a tonne of work)
Summary
Challenges
- Data is "From" and "To" instead of a fixed date
- Data needs to be refreshed from a data source (in this case a SharePoint List)
- We do not have data-points for every single day (only the "out of office" travel data) but we still need to RENDER every single day
Examples of the data
- Name: John Smith | From: 10/12/2018 | To: 12/12/2018
- Name: John Smith | From: 24/12/2018 | To: 28/12/2018
- ... etc ...
Example of how I rendered it in Excel