Get certified for free when you join Fabric Data Days 2026 and dive into Fabric, Power BI, SQL, AI, and other essential data skills.
Join nowJuly 7 - July 17 | Round 2 of the Power BI Dataviz World Championships. Don't miss your chance! Learn more
Hello,
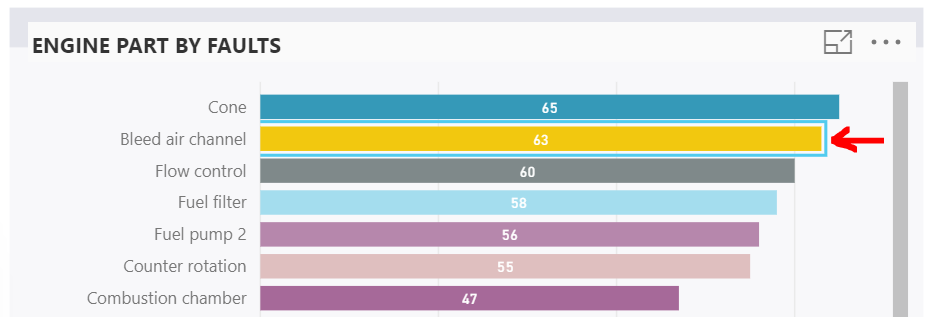
I am embedding a report into an app and have identified an issue. When selecting the "more options" three dots at the top of a widget, a blue outline starts to appear around everything that is subsequently clicked. This is particularly evident / frustrating from a UX perspective with certain widgets, e.g. scatter chart.
I did some investigation into whether this was an issue on my end or just a general embedded issue and it seems to apply to all embedded reports, e.g. see a screenshot from a demo app below or link here: https://fleetdemoapp.azurewebsites.net/#
Does anyone have any info on this or updates on whether this will be resolved?
Thanks,
Join us in Barcelona for FabCon and SQLCon, the Fabric, Power BI, SQL, and AI community event. Save €200 with code FABCMTY200.
Join Data Days 2026: 60 days of free live/on-demand sessions, challenges, study groups, and certification opportunities.
| User | Count |
|---|---|
| 2 | |
| 2 | |
| 1 | |
| 1 | |
| 1 |
| User | Count |
|---|---|
| 4 | |
| 3 | |
| 2 | |
| 2 | |
| 1 |