Hi khana04,
Firstly, in your measure, are you using RANKX() to calculate the measure [ScrapCodeRANK]? If you are, RANKX() will always return the same ranking for the same value.
In addition. TopN() will take all the rows with same value in a column as one row. So, to achieve your requirement, you should use edit query to create a new ranking column instead of using DAX.
Please refer to steps below:
- Calculate [%ByScrapCode] using Power Query instead of DAX in Power BI Desktop, which will make [%ByScrapCode] as a column in your table, if you have any questions about how to calculate [%ByScrapCode] in query editor, please share sample data of your table.
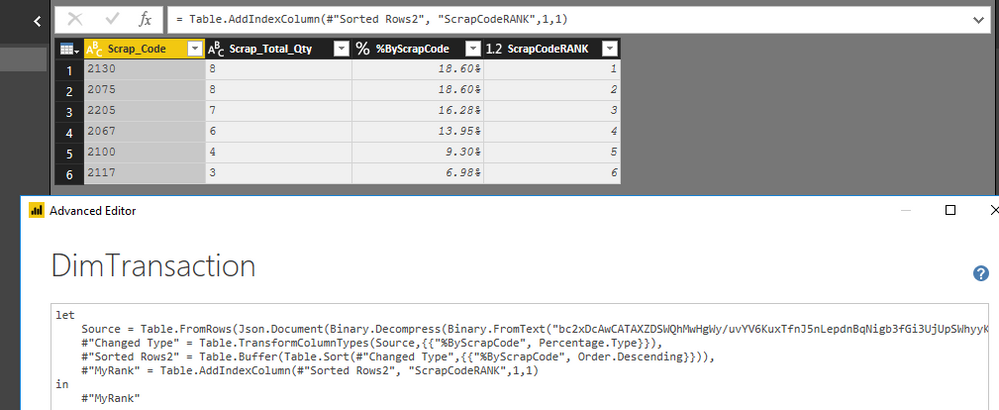
- Sort table ‘DimTransaction’ by column [%ByScrapCode], then create an index column [ScrapCodeRANK] from 1. You can use M formula below in Edit Queries:
let
Source = Table.FromRows(Json.Document(Binary.Decompress(Binary.FromText("bc2xDcAwCATAXZDSWQhMwHgWy/uvYV6KuxTfnJ5nLepdnBqNigb3fGi3UjUpSWhyyKcy/E8D1wE1nn4XBAtvZbLdqiqqhjpP/NoH", BinaryEncoding.Base64), Compression.Deflate)), let _t = ((type text) meta [Serialized.Text = true]) in type table [Scrap_Code = _t, Scrap_Total_Qty = _t, #"%ByScrapCode" = _t]),
#"Changed Type" = Table.TransformColumnTypes(Source,{{"%ByScrapCode", Percentage.Type}}),
#"Sorted Rows2" = Table.Buffer(Table.Sort(#"Changed Type",{{"%ByScrapCode", Order.Descending}})),
#"MyRank" = Table.AddIndexColumn(#"Sorted Rows2", "ScrapCodeRANK",1,1)
in
#"MyRank"
The result is like below:
3.Creata measures [RunningTotals] with DAX formula below:
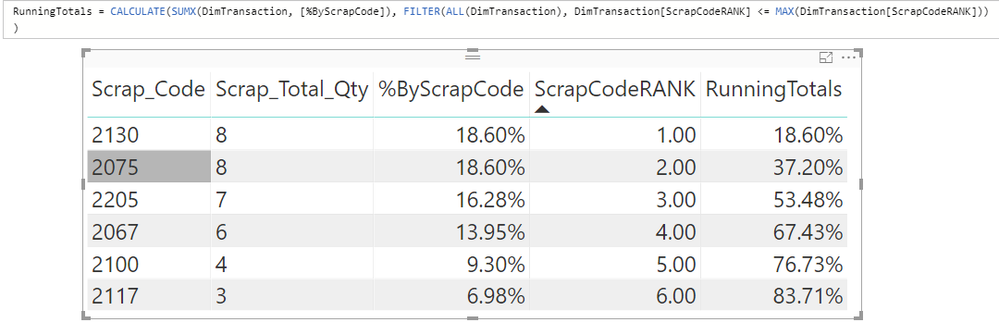
RunningTotals = CALCULATE(SUMX(DimTransaction, [%ByScrapCode]), FILTER(ALL(DimTransaction), DimTransaction[ScrapCodeRANK] <= MAX(DimTransaction[ScrapCodeRANK])))
The final result is like below and you can refer to PBIX file here:
https://www.dropbox.com/s/e2x5l2hj41sl13n/For%20khana04.pbix?dl=0
Best Regards,
Jimmy Tao


