FabCon is coming to Atlanta
Join us at FabCon Atlanta from March 16 - 20, 2026, for the ultimate Fabric, Power BI, AI and SQL community-led event. Save $200 with code FABCOMM.
Register now!- Power BI forums
- Get Help with Power BI
- Desktop
- Service
- Report Server
- Power Query
- Mobile Apps
- Developer
- DAX Commands and Tips
- Custom Visuals Development Discussion
- Health and Life Sciences
- Power BI Spanish forums
- Translated Spanish Desktop
- Training and Consulting
- Instructor Led Training
- Dashboard in a Day for Women, by Women
- Galleries
- Data Stories Gallery
- Themes Gallery
- Contests Gallery
- QuickViz Gallery
- Quick Measures Gallery
- Visual Calculations Gallery
- Notebook Gallery
- Translytical Task Flow Gallery
- TMDL Gallery
- R Script Showcase
- Webinars and Video Gallery
- Ideas
- Custom Visuals Ideas (read-only)
- Issues
- Issues
- Events
- Upcoming Events
The Power BI Data Visualization World Championships is back! Get ahead of the game and start preparing now! Learn more
- Power BI forums
- Forums
- Get Help with Power BI
- Developer
- Custom Visual R - leaflet with highcharter tooltip
- Subscribe to RSS Feed
- Mark Topic as New
- Mark Topic as Read
- Float this Topic for Current User
- Bookmark
- Subscribe
- Printer Friendly Page
- Mark as New
- Bookmark
- Subscribe
- Mute
- Subscribe to RSS Feed
- Permalink
- Report Inappropriate Content
Custom Visual R - leaflet with highcharter tooltip
Hello,
I'm trying to add a chart as a tooltip when clicking on my data point in a map.
For this I'm using the leaflet package to create a map and the data point on a specific location and the chart as a tooltip comes from the highcharter package. I'm basically trying to get the same result as discussed in this link on StackOverflow: https://stackoverflow.com/questions/59173708/r-leaflet-highcharter-tooltip
This is the piece of code that is used in my custom visual based in R, so with RHTML ->
source('./r_files/flatten_HTML.r')

############### Library Declarations ###############
libraryRequireInstall("leaflet");
libraryRequireInstall("sf");
libraryRequireInstall("htmlwidgets");
libraryRequireInstall("dplyr");
libraryRequireInstall("stringr");
libraryRequireInstall("htmltools");
libraryRequireInstall("highcharter");

as.character.htmlwidget <- function(x, ...) {
  htmltools::HTML(
    htmltools:::as.character.shiny.tag.list(
      htmlwidgets:::as.tags.htmlwidget(
        x
      ),
      ...
    )
  )
}

add_deps <- function(dtbl, name, pkg = name) {
  tagList(
    dtbl,
    htmlwidgets::getDependency(name, pkg)
  )
}

Leaflet_Map <- leaflet()
Leaflet_Map <- addProviderTiles(Leaflet_Map, providers$CartoDB)
Leaflet_Map <- addCircleMarkers(Leaflet_Map, lat = 45.4, lng = 14.9,
                   popup = list(paste(as.character(
                     hchart(data.frame(x = 1:10, y = 1:10), type = "line", hcaes(x = x, y = y)) %>% hc_size(width = 300, height = 200)
                     ))),
                   popupOptions = popupOptions(minWidth = 300, maxHeight = 200))


Leaflet_Map <-  onRender(Leaflet_Map,
    "
function(el,x) {
  this.on('popupopen', function() {HTMLWidgets.staticRender();})
}
") %>% add_deps("highchart", 'highcharter')  %>% browsable()
############# Create and save widget ###############
internalSaveWidget(Leaflet_Map, 'out.html')
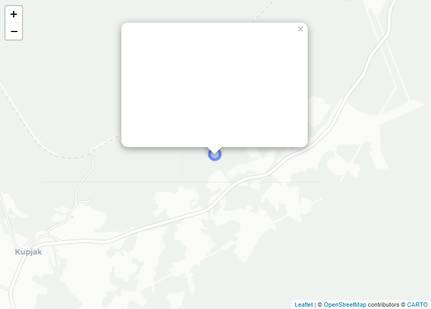
The problem is that the piece of code 'add_deps("highchart", 'highcharter')' gives me the error. If I remove it, I'm almost getting the right result which is an empty box.
But when I use the full code with the adding of 'add_deps("highchart", 'highcharter')', I get this error:
My first thought was to change something in the function internalSaveWidget which resides in the 'flatten_HTML.r' file.
Can somebody help me with this problem please?
- Mark as New
- Bookmark
- Subscribe
- Mute
- Subscribe to RSS Feed
- Permalink
- Report Inappropriate Content
Hi @naelske_cronos ,
Please refer to this blog to check whether your highchart option is correct.
For reference: What is highcharter?
Here is a similar post like yours about how to add tooltips in Power BI custom R visual.
For reference: Change R visual to Custom visual with Tooltip
I hope they could help you solve your problem.
Best Regards,
Rico Zhou
If this post helps, then please consider Accept it as the solution to help the other members find it more quickly.
- Mark as New
- Bookmark
- Subscribe
- Mute
- Subscribe to RSS Feed
- Permalink
- Report Inappropriate Content
Hello @Anonymous
I don't have enough with this information. I thought having more information about the error in the code but no problem. I'll not accept this as an answer to my solution but thanks for your reply.
I used another method to show a tooltip with the R custom visual and this is saving a plot with the ggplot package to a SVG file. This works perfectly!
Kind regards
Helpful resources

Power BI Dataviz World Championships
The Power BI Data Visualization World Championships is back! Get ahead of the game and start preparing now!

| User | Count |
|---|---|
| 3 | |
| 2 | |
| 2 | |
| 1 | |
| 1 |
| User | Count |
|---|---|
| 11 | |
| 7 | |
| 4 | |
| 4 | |
| 3 |


