Huge last-minute discounts for FabCon Vienna from September 15-18, 2025
Supplies are limited. Contact info@espc.tech right away to save your spot before the conference sells out.
Get your discount- Power BI forums
- Get Help with Power BI
- Desktop
- Service
- Report Server
- Power Query
- Mobile Apps
- Developer
- DAX Commands and Tips
- Custom Visuals Development Discussion
- Health and Life Sciences
- Power BI Spanish forums
- Translated Spanish Desktop
- Training and Consulting
- Instructor Led Training
- Dashboard in a Day for Women, by Women
- Galleries
- Data Stories Gallery
- Themes Gallery
- Contests Gallery
- Quick Measures Gallery
- Notebook Gallery
- Translytical Task Flow Gallery
- TMDL Gallery
- R Script Showcase
- Webinars and Video Gallery
- Ideas
- Custom Visuals Ideas (read-only)
- Issues
- Issues
- Events
- Upcoming Events
Score big with last-minute savings on the final tickets to FabCon Vienna. Secure your discount
- Power BI forums
- Forums
- Get Help with Power BI
- Developer
- [Bug] Empty space above Card when it is embedded a...
- Subscribe to RSS Feed
- Mark Topic as New
- Mark Topic as Read
- Float this Topic for Current User
- Bookmark
- Subscribe
- Printer Friendly Page
- Mark as New
- Bookmark
- Subscribe
- Mute
- Subscribe to RSS Feed
- Permalink
- Report Inappropriate Content
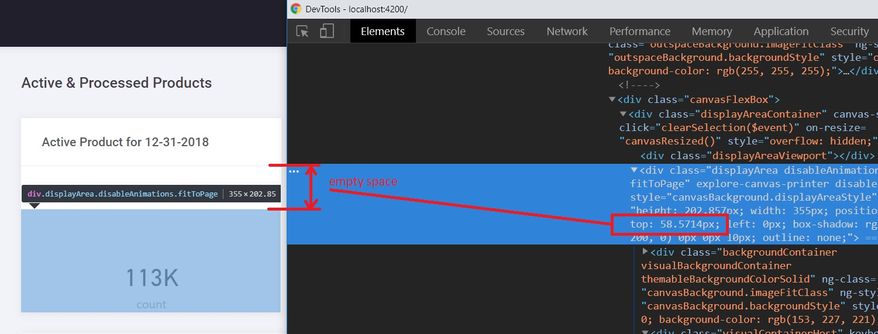
[Bug] Empty space above Card when it is embedded as Single Visual
We display PowerBI report visuals with the Microsoft embed library https://github.com/Microsoft/PowerBI-JavaScript in a custom web container. We embed a single visual as explained here https://github.com/Microsoft/PowerBI-JavaScript/wiki/Embed-Single-Visual. All our visuals (e.g. Line, Table) are displayed correctly, except visuals of type Card. Only Card visuals have css style {top: 60px;}
In settings object of an embed these visuals have the following values
{
  "localeSettings": {
    "language": "en",
    "formatLocale": "en-US"
  },
  "filterPaneEnabled": false,
  "navContentPaneEnabled": false,
  "background": 1,
  "visualSettings": {
    "visualHeaders": [
      {
        "settings": {
          "visible": false
        }
      }
    ]
  },
  "layoutType": 1,
  "customLayout": {
    "displayOption": 0,
    "pageSize": {
      "type": 4,
      "width": 350,
      "height": 200
    },
    "pagesLayout": {
      "ReportSection28597ec2e72b1fca03df": {
        "defaultLayout": {
          "displayState": {
            "mode": 1
          }
        },
        "visualsLayout": {
          "8a5ae98a6614fee5dd79": {
            "displayState": {
              "mode": 0
            },
            "x": 1,
            "y": 1,
            "z": 1,
            "width": 350,
            "height": 200
          }
        }
      }
    }
  }
}
As you can see, filterPane, navContentPane and visualHeaders are set to false. So, nothing should be above or around it...
Has somebody came accross this issue or similar? Is it a bug or we miss something?
- Mark as New
- Bookmark
- Subscribe
- Mute
- Subscribe to RSS Feed
- Permalink
- Report Inappropriate Content
I am still trying to overcome this issue
I created completely empty report with just only one visual - card and set it up to show constant 5
The issue is still there. So, it is not related to some specific PBI Connector or other visuals in report
Has anybody came accross this issue or similar?
Would be helpfull if MS Support team wrote recommendations for this case. Is it a known bug?
Helpful resources
| User | Count |
|---|---|
| 10 | |
| 5 | |
| 4 | |
| 4 | |
| 3 |
| User | Count |
|---|---|
| 14 | |
| 9 | |
| 5 | |
| 5 | |
| 4 |


