cancel
Showing results for 
Search instead for 
Did you mean: 

July 7 - July 17 | Round 2 of the Power BI Dataviz World Championships. Don't miss your chance! Learn more

Reply
Anonymous
Not applicable

undefined

Hello everyone,


I'll try to explain all quick and short and add example files.

I have data from a survey which shows category 1-5, rating 1-5, and weighting 1-5 in a wide list.

Since category 1-5 all contain the same kind of category, it makes sense to show them in long format.

If I unpivot, categories come in rows, which is good. But I want to multiply rating x weighting, which should only be in 2 seperate columns, for category 1, only rating 1 and weighting and weighting 1 should be in the columns behind category. How can I do that?


Example file shows data in sheet 1, and how it is supposed to look like in sheet 2: Example File

1 ACCEPTED SOLUTION
v-yuta-msft
Community Support
Community Support

@Anonymous ,


In power query, create a custom function to select the three columns and append them using code like pattern below:


let
Source = Excel.Workbook(File.Contents("C:\Users\JimmyTao\Desktop\Client satisfaction survey.xlsx"), null, true),
#"Sheet 1_Sheet" = Source{[Item="Sheet 1",Kind="Sheet"]}[Data],
#"Promoted Headers" = Table.PromoteHeaders(#"Sheet 1_Sheet", [PromoteAllScalars=true]),
#"Changed Type" = Table.TransformColumnTypes(#"Promoted Headers",{{"respondent_id", Int64.Type}, {"collector_id", Int64.Type}, {"date_created", type datetime}, {"date_modified", type datetime}, {"Column5", type any}, {"Column6", type any}, {"Column7", type any}, {"Column8", type any}, {"Column9", type any}, {"Project", type text}, {"Projektnummer", Int64.Type}, {"Deliverymanager", type text}, {"Date", type text}, {"Client", type text}, {"Column15", type any}, {"Client Organisation", type text}, {"Column17", type any}, {"Column18", type any}, {"Column19", type any}, {"Category 1", Int64.Type}, {"Rating 1", Int64.Type}, {"Category 2", Int64.Type}, {"Rating 2", Int64.Type}, {"Category 3", Int64.Type}, {"Rating 3", Int64.Type}, {"Category 4", Int64.Type}, {"Rating 4", Int64.Type}, {"Category 5", Int64.Type}, {"Rating 5", Int64.Type}, {"Column30", type any}, {"Weighting 1", Int64.Type}, {"Weighting 2", Int64.Type}, {"Weighting 3", Int64.Type}, {"Weighting 4", Int64.Type}, {"Weighting 5", Int64.Type}}),
fn = (Table as table, Column1 as text, Column2 as text, Column3 as text) =>
Table.Combine({Table, Table.RenameColumns(Table.SelectColumns(#"Changed Type", {Column1, Column2, Column3}), {{Column1, Text.Start(Column1, 8)}, {Column2, Text.Start(Column2, 6)}, {Column3, Text.Start(Column3, 9)}})}),
Table = Table.RenameColumns(Table.SelectColumns(#"Changed Type", {"Category 1", "Rating 1", "Weighting 1"}), {{"Category 1", "Category"}, {"Rating 1", "Rating"}, {"Weighting 1", "Weighting"}}),
Result = fn(fn(fn(fn(Table, "Category 2", "Rating 2", "Weighting 2"), "Category 3", "Rating 3", "Weighting 3"), "Category 4", "Rating 4", "Weighting 4"), "Category 5", "Rating 5", "Weighting 5")
in
Result

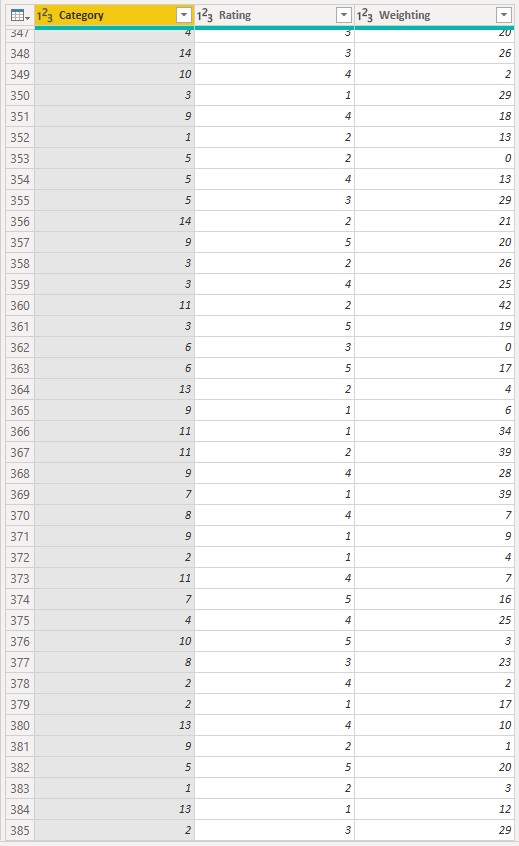
The result is as below:
Capture.PNG 


Community Support Team _ Jimmy Tao

If this post helps, then please consider Accept it as the solution to help the other members find it more quickly.


View solution in original post

2 REPLIES 2
v-yuta-msft
Community Support
Community Support

@Anonymous ,


In power query, create a custom function to select the three columns and append them using code like pattern below:


let
Source = Excel.Workbook(File.Contents("C:\Users\JimmyTao\Desktop\Client satisfaction survey.xlsx"), null, true),
#"Sheet 1_Sheet" = Source{[Item="Sheet 1",Kind="Sheet"]}[Data],
#"Promoted Headers" = Table.PromoteHeaders(#"Sheet 1_Sheet", [PromoteAllScalars=true]),
#"Changed Type" = Table.TransformColumnTypes(#"Promoted Headers",{{"respondent_id", Int64.Type}, {"collector_id", Int64.Type}, {"date_created", type datetime}, {"date_modified", type datetime}, {"Column5", type any}, {"Column6", type any}, {"Column7", type any}, {"Column8", type any}, {"Column9", type any}, {"Project", type text}, {"Projektnummer", Int64.Type}, {"Deliverymanager", type text}, {"Date", type text}, {"Client", type text}, {"Column15", type any}, {"Client Organisation", type text}, {"Column17", type any}, {"Column18", type any}, {"Column19", type any}, {"Category 1", Int64.Type}, {"Rating 1", Int64.Type}, {"Category 2", Int64.Type}, {"Rating 2", Int64.Type}, {"Category 3", Int64.Type}, {"Rating 3", Int64.Type}, {"Category 4", Int64.Type}, {"Rating 4", Int64.Type}, {"Category 5", Int64.Type}, {"Rating 5", Int64.Type}, {"Column30", type any}, {"Weighting 1", Int64.Type}, {"Weighting 2", Int64.Type}, {"Weighting 3", Int64.Type}, {"Weighting 4", Int64.Type}, {"Weighting 5", Int64.Type}}),
fn = (Table as table, Column1 as text, Column2 as text, Column3 as text) =>
Table.Combine({Table, Table.RenameColumns(Table.SelectColumns(#"Changed Type", {Column1, Column2, Column3}), {{Column1, Text.Start(Column1, 8)}, {Column2, Text.Start(Column2, 6)}, {Column3, Text.Start(Column3, 9)}})}),
Table = Table.RenameColumns(Table.SelectColumns(#"Changed Type", {"Category 1", "Rating 1", "Weighting 1"}), {{"Category 1", "Category"}, {"Rating 1", "Rating"}, {"Weighting 1", "Weighting"}}),
Result = fn(fn(fn(fn(Table, "Category 2", "Rating 2", "Weighting 2"), "Category 3", "Rating 3", "Weighting 3"), "Category 4", "Rating 4", "Weighting 4"), "Category 5", "Rating 5", "Weighting 5")
in
Result

The result is as below:

Capture.PNG 


Community Support Team _ Jimmy Tao

If this post helps, then please consider Accept it as the solution to help the other members find it more quickly.


Anonymous
Not applicable

That works perfectly. Thank you so much!

Helpful resources

Announcements
FabCon and SQLCon Barcelona 2026

FabCon & SQLCon – Barcelona 2026

Join us in Barcelona for FabCon and SQLCon, the Fabric, Power BI, SQL, and AI community event. Save €200 with code FABCMTY200.

July Power BI Update Carousel

Power BI Monthly Update - July 2026

Check out the July 2026 Power BI update to learn about new features.

60 days of Data Days Carousel

Data Days 2026

Join Data Days 2026: 60 days of free live/on-demand sessions, challenges, study groups, and certification opportunities.

Power BI DataViz World Championships carousel

Power BI DataViz World Championships - June 2026

A new Power BI DataViz World Championship is coming this June! Don't miss out on submitting your entry.

Top Solution Authors