Fabric Data Days starts November 4th!
Advance your Data & AI career with 50 days of live learning, dataviz contests, hands-on challenges, study groups & certifications and more!
Get registered- Power BI forums
- Get Help with Power BI
- Desktop
- Service
- Report Server
- Power Query
- Mobile Apps
- Developer
- DAX Commands and Tips
- Custom Visuals Development Discussion
- Health and Life Sciences
- Power BI Spanish forums
- Translated Spanish Desktop
- Training and Consulting
- Instructor Led Training
- Dashboard in a Day for Women, by Women
- Galleries
- Data Stories Gallery
- Themes Gallery
- Contests Gallery
- QuickViz Gallery
- Quick Measures Gallery
- Visual Calculations Gallery
- Notebook Gallery
- Translytical Task Flow Gallery
- TMDL Gallery
- R Script Showcase
- Webinars and Video Gallery
- Ideas
- Custom Visuals Ideas (read-only)
- Issues
- Issues
- Events
- Upcoming Events
Get Fabric Certified for FREE during Fabric Data Days. Don't miss your chance! Request now
- Power BI forums
- Forums
- Get Help with Power BI
- Desktop
- total value for a calculated measure column is not...
- Subscribe to RSS Feed
- Mark Topic as New
- Mark Topic as Read
- Float this Topic for Current User
- Bookmark
- Subscribe
- Printer Friendly Page
- Mark as New
- Bookmark
- Subscribe
- Mute
- Subscribe to RSS Feed
- Permalink
- Report Inappropriate Content
total value for a calculated measure column is not correct
Hi all,
sorry if this is a repeated question. I went through few other threads that looked similar, but still haven't been able to work it out. I am new to Power BI and still getting my head around the wonderful tool. Any help appreciated.
What I want to achieve
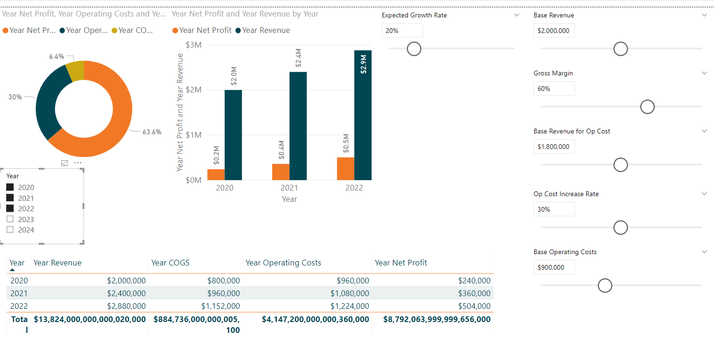
Prepare a financial forecasting tool that will update the future outlook based on altering the assumptions about varioud things (screenshot attached).
What I have done
I created a single table that includes the Years that I want to include in the report.
Added bunch of What-if parameters that will be used to play with the forecasts
Then everything else is measure calculated with PRODUCTX() on that table.
For example, Annual Revenue formula is as below:
Year Revenue = PRODUCTX(
                       'Finance Forecast',
                       'Base Revenue'[Base Revenue Value] * POWER(1+[Expected Growth Rate Value], 'Finance Forecast'[Year Index]-1)
                        )
Financial Forecast table is as below:
Questions:
- Is this the best way to achieve what I want to get?
- How to fix the totals column?
Solved! Go to Solution.
- Mark as New
- Bookmark
- Subscribe
- Mute
- Subscribe to RSS Feed
- Permalink
- Report Inappropriate Content
Hi,
Does this work?
=IF(HASONEVALUE([Year]),[Year Revenue],SUMX(SUMMARIZE(VALUES([Year]),[Year],"Rev",[Year Revenue]),[Rev]))
Regards,
Ashish Mathur
http://www.ashishmathur.com
https://www.linkedin.com/in/excelenthusiasts/
- Mark as New
- Bookmark
- Subscribe
- Mute
- Subscribe to RSS Feed
- Permalink
- Report Inappropriate Content
Thanks for quick respond @Ashish_Mathur
That did the trick 🙂
I combined the two in one measure as below:
Year Revenue = IF(HASONEVALUE(Years[Year]),
                    PRODUCTX(
                            'Years',
                            'Base Revenue'[Base Revenue Value] * POWER(1+[Expected Growth Rate Value], 'Years'[Year Index]-1)
                            ),
                    SUMX(SUMMARIZE(VALUES(Years[Year]),
                                   Years[Year],
                                   "Rev",
                                    PRODUCTX(
                                            'Years',
                                            'Base Revenue'[Base Revenue Value] * POWER(1+[Expected Growth Rate Value], 'Years'[Year Index]-1)
                                            )
                                    ),
                        [Rev])
                    )
and now trying to digest what just happened haha
- Mark as New
- Bookmark
- Subscribe
- Mute
- Subscribe to RSS Feed
- Permalink
- Report Inappropriate Content
You are welcome.
Regards,
Ashish Mathur
http://www.ashishmathur.com
https://www.linkedin.com/in/excelenthusiasts/
Helpful resources

Power BI Monthly Update - November 2025
Check out the November 2025 Power BI update to learn about new features.

Fabric Data Days
Advance your Data & AI career with 50 days of live learning, contests, hands-on challenges, study groups & certifications and more!

| User | Count |
|---|---|
| 93 | |
| 69 | |
| 50 | |
| 40 | |
| 39 |


