FabCon is coming to Atlanta
Join us at FabCon Atlanta from March 16 - 20, 2026, for the ultimate Fabric, Power BI, AI and SQL community-led event. Save $200 with code FABCOMM.
Register now!- Power BI forums
- Get Help with Power BI
- Desktop
- Service
- Report Server
- Power Query
- Mobile Apps
- Developer
- DAX Commands and Tips
- Custom Visuals Development Discussion
- Health and Life Sciences
- Power BI Spanish forums
- Translated Spanish Desktop
- Training and Consulting
- Instructor Led Training
- Dashboard in a Day for Women, by Women
- Galleries
- Data Stories Gallery
- Themes Gallery
- Contests Gallery
- QuickViz Gallery
- Quick Measures Gallery
- Visual Calculations Gallery
- Notebook Gallery
- Translytical Task Flow Gallery
- TMDL Gallery
- R Script Showcase
- Webinars and Video Gallery
- Ideas
- Custom Visuals Ideas (read-only)
- Issues
- Issues
- Events
- Upcoming Events
The Power BI Data Visualization World Championships is back! Get ahead of the game and start preparing now! Learn more
- Power BI forums
- Forums
- Get Help with Power BI
- Desktop
- Re: measure as a filter
- Subscribe to RSS Feed
- Mark Topic as New
- Mark Topic as Read
- Float this Topic for Current User
- Bookmark
- Subscribe
- Printer Friendly Page
- Mark as New
- Bookmark
- Subscribe
- Mute
- Subscribe to RSS Feed
- Permalink
- Report Inappropriate Content
measure as a filter
Hello,
I am stuck on the following problem. Please help.
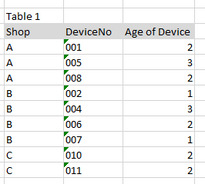
Table 1 contains:
My sales data is from a measure - from Table 2 (which I am able to do) is like:
My desired output is showing count of device at shop that has no sales.
I was trying to put into a matrix, but as soon as I put shop as row and even sales =0 as filter, all shops data shows regardless has sales or not.
Any help is appreciated.
Solved! Go to Solution.
- Mark as New
- Bookmark
- Subscribe
- Mute
- Subscribe to RSS Feed
- Permalink
- Report Inappropriate Content
Hi @Anonymous
I've updated the PBIX file from that simple model and have it working as I think you need.
Bascially I've added a +0 to the end to the end of the sales measure and also was careful about which shop field to use in my matrix. I use the field from Table2 rather than Table1
https://1drv.ms/u/s!AtDlC2rep7a-oBnYHCJluU2V97bz
- Mark as New
- Bookmark
- Subscribe
- Mute
- Subscribe to RSS Feed
- Permalink
- Report Inappropriate Content
I use [Table 2] to effectively operate as a dimenstion table (one row per shop and now more). Which allows me to create a relationship with [Table1] and [Sales] that have many lines for each shop.
Otherwise you can't have a relationship between [Sales] and [Table2] and need to rely on some pretty in-efficient methods to create the calcualtion.
- Mark as New
- Bookmark
- Subscribe
- Mute
- Subscribe to RSS Feed
- Permalink
- Report Inappropriate Content
HI @Anonymous
I managed to get it to work as fas as I understand you need to.
Is the Sales column in Table 2 and actual column or a calculated measure?
Here is the very basic PBIX File I mocked up
https://1drv.ms/u/s!AtDlC2rep7a-oBnYHCJluU2V97bz
- Mark as New
- Bookmark
- Subscribe
- Mute
- Subscribe to RSS Feed
- Permalink
- Report Inappropriate Content
Thanks for your reply.
Sales info is a calculated measure from another table. (Basically, it is just sum of sales group by Shop to be shown).
- Mark as New
- Bookmark
- Subscribe
- Mute
- Subscribe to RSS Feed
- Permalink
- Report Inappropriate Content
Hi @Anonymous
I've updated the PBIX file from that simple model and have it working as I think you need.
Bascially I've added a +0 to the end to the end of the sales measure and also was careful about which shop field to use in my matrix. I use the field from Table2 rather than Table1
https://1drv.ms/u/s!AtDlC2rep7a-oBnYHCJluU2V97bz
- Mark as New
- Bookmark
- Subscribe
- Mute
- Subscribe to RSS Feed
- Permalink
- Report Inappropriate Content
Thanks.
I am a bit confused with your 3 tables approach now.
Basically, I have Sales and Table 1, I am not sure how to create Table 2 and what is the purpose of it.
Is it possible to get the same result with only Sales and Table 1?
- Mark as New
- Bookmark
- Subscribe
- Mute
- Subscribe to RSS Feed
- Permalink
- Report Inappropriate Content
I use [Table 2] to effectively operate as a dimenstion table (one row per shop and now more). Which allows me to create a relationship with [Table1] and [Sales] that have many lines for each shop.
Otherwise you can't have a relationship between [Sales] and [Table2] and need to rely on some pretty in-efficient methods to create the calcualtion.
Helpful resources

Power BI Dataviz World Championships
The Power BI Data Visualization World Championships is back! Get ahead of the game and start preparing now!

| User | Count |
|---|---|
| 38 | |
| 38 | |
| 36 | |
| 28 | |
| 28 |
| User | Count |
|---|---|
| 124 | |
| 88 | |
| 74 | |
| 66 | |
| 65 |


